Inside Mathematics
Graphs (2006)
When told to describe a line, do your pupils list its color, length, and which side is high or low? Use a worksheet that engages scholars to properly label line graphs. It then requests two applied reasoning answers.
Hawaiʻi State Department of Education
What’s My Vocabulary Word?
The elements of dance can be used to communicate thoughts and, in this case, words. In small groups, the class first creates a set of movements to show a single word. Then, they extend their movements to show a three-word phrase....
National Energy Education Development Project
Introduction to Hydrogen
Every region has a renewable resource that can be used to make hydrogen. But, what is hydrogen and why can it be used as an energy source? Find out with a presentation that answers these questions and then discusses where hydrogen is...
Curated OER
Trends of Snow Cover and Temperature in Alaska
Students gather historical snow cover and temperature data from the MY NASA DATA Web site. They compare this data to data gathered using ground measurements from the ALISON Web site for Shageluk Lake. They graph both sets of data and...
Curated OER
Giants of the Century
Middle and high schoolers study significant people who shaped the 20th-century history and are introduced to database tools. Researchers use the Internet to research five 20th century history makers. They write a short biography of five...
Orlando Shakes
Arms and the Man: Study Guide
Few aspects of life make better fodder for a comedic play than politics. A study guide introduces George Bernard's Shaw comedy Arms and the Man. Along with summaries of each scene and brief biographies of the main characters, two lesson...
Curated OER
The Number Line
Learners graph and order numbers using a number line. They also solve word problems using fractions and decimals and rewrite equations to solve problems correctly. Several example word problems are given.
Mikva Challenge
The Great Electoral Race Kickoff
Do young people care about elections? Host a discussion about the role of young citizens in the electoral process with an engaging social studies lesson. As high schoolers read and respond to four statements about youth interest in...
American Press Institute
High Five: Media Literacy and Newspapers
Teach the five different types of media with the first of three in a media literacy unit. Learners create and propose a final newspaper project, which must address information covered throughout the unit.
Curated OER
Fuels - The Good, the Bad, and the Ugly
Science pupils choose from twelve questions about five different types of fuel: hydrogen, ethanol, crude oil, natural gas, and coal. They construct a table to compare them and then determine which is the best fuel. Your physical science...
Curated OER
Energy Conservation
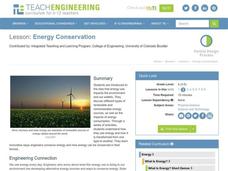
Students investigate energy conservation. In this energy conservation and analyzing data instructional activity, students identify and explain several energy sources and research renewable and nonrenewable energy sources. Students use...
Curated OER
Systems of Equations and Inequalities
This is a comprehensive lesson on creating and solving equations and systems of equations and inequalities. Problems range from basic linear equations to more complex systems of equations and inequalities based on a real-world examples....
Alabama Learning Exchange
Ice Fishing is for the Birds
Approach addition with young mathematicians in an engaging way through this penguin-inspired activity. In small groups, scholars think about times they have used addition in their real lives (there are some suggestions given), then watch...
Curated OER
Hobbies Lesson Plan #2
Explore different physical activities with your French classes! Learners complete three exercises here to develop sports-related vocabulary. First, they find various benefits for a list of sports. Then, they match the accessories...
Curated OER
US Households
Learners construct and use inverse functions to model a real-world context. They use the inverse function to interpolate a data point.
National Security Agency
Starting a Restaurant
Through an engaging unit, chefs-in-training will sort and classify data using tally charts. Learners will also create bar graphs to display restaurant data and interpret data from bar graphs using a variety of categories. This is a fun...
Mathematics Assessment Project
Sampling and Estimating: Counting Trees
Your task today: count all the trees on a tree farm. To complete the assignment, learners first estimate the number of trees on a tree farm using random sampling. To improve their own response they then evaluate provided responses to the...
Noyce Foundation
Fair Game?
The game should be fair at all costs. The mini-assessment revolves around the ability to use probabilities to determine whether a game is fair. Individuals determine compound events to calculate simple probabilities and make long-run...
Inside Mathematics
Squares and Circles
It's all about lines when going around. Pupils graph the relationship between the length of a side of a square and its perimeter. Class members explain the origin in context of the side length and perimeter. They compare the graph to the...
Code.org
Rapid Research – Data Innovations
Scholars conduct research into a computing innovation of their choice and figure out how it uses data. They prepare brief reports of their research in the second installment of the series.
Google
Art: Digital Art
There's no need to filter out the project. Future computer scientists set up a program that acts like a photography filter to complete the sixth of eight parts in the Google CS Art unit. They use the turbo mode in the Scratch coding...
Curated OER
India and Pakistan: Rivals from Birth
Seventh graders, after being divided into two groups, are assigned either Pakistan or India. They conduct research using the Internet, reference books, and magazines. The class compares and contrasts the two countries to find sources of...
Curated OER
A Closer look at Oil and Energy Consumption
Upper graders analyze basic concepts about the consumption, importation and exportation of the worlds oil production. They create several graphs to organize the data and draw conclusions about the overall use of oil in the world.
Curated OER
Cross Cultural Transportation and Resources Exchange
Students examine various modes of transportation. They explore regional transportation options and discover options available in their area. Students survey types of transportation people use in their area. Using spreadsheet data,...


