Curated OER
Inventors Unit Survey
Students develop and conduct a survey for their inventors unit. They create a five question survey and tally the survey results, and create a graph using Microsoft Word and Graph Club 2.0.
Curated OER
Questionnaires and Analysis
Students, review the techniques and different types of data analysis as well as how they are expressed, identify why facts and data are needed in conclusion of a questionnaire. The concepts of qualitative and quantitative data are...
Curated OER
Exercise Those Statistics!
Students participate in various activities, measuring their pulse rates and recording the data. They analyze the statistical concepts of mean, median, mode, and histograms using the data from the cardiovascular activities.
Curated OER
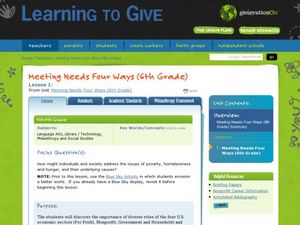
Meeting Needs Four Ways: The Drive (6th)
Students study the U.S. economic sectors and their philanthropic role in communities. In this civil society lesson, students brainstorm and classify businesses in their community. Students discuss the for-profit, nonprofit, government...
Curated OER
What Do Plants Need to Grow?
Fourth graders control variables to determine the effect on plant growth. They collect information by observing and measuring and construct simple graphs, tables, maps and charts to organize, examine and evaluate information.
Curated OER
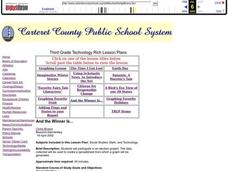
And the Winner Is...
Third graders participate in an election project. They collect data to create a spreadsheet from which a graph is generated.
Curated OER
What's Your Favorite Stuffed Animal?
Second graders gather information in a survey and interpret the results using a tally chart, a table, and a bar graph. They' present their results of the during the final group discussion. The subject of the survey is favorite stuffed...
Curated OER
State Economy Chart
Fifth graders create a 3D Pie graph using the Chart Wizard in Excel to represent their assigned states' data. They discuss the similarities and differences between states, and form a hypothesis on the relationship between location and...
Curated OER
Parts of a Whole
Fourth graders explore fractions through the analysis of various paintings. They view and discuss paintings by Picasso and Seurat, discuss the fractional examples in the paintings, and create a bar graph.
Curated OER
Data Shuffle
Middle schoolers find an advertisement or newspaper using charts or graphs. They create another graph using the same information in a different format. They write a comparison of the two graphs.
Curated OER
Blowing in the Wind
Pupils identify and interpret maps, graphs, charts, tables and political cartoons. Students identify what a compass rose is and review its meaning in relation to standard directions. Pupils design their own weathervanes. Students pencil...
Curated OER
The Bigger they Are . . .
Pupils do a variety of data analyses of real-life basketball statistics from the NBA. They chart and graph rebounding, scoring, shot blocking and steals data which are gathered from the newspaper sports section.
Curated OER
Give It Back From a Snack Lesson 2: Invest With the Best
Students survey schoolmate as to what type of snacks they would prefer to purchase. They graph the results and apply them to planning a classroom snack sale while examining what wants, needs, and consumers are.
Curated OER
Tracking Sunrise and Sunset
Young scholars collect, record, and graph the sunrise and sunset times. They explain how the relationship between the tilt of Earth's axis and its yearly orbit around the sun produces the seasons.
Curated OER
Foreign Stamps
Eighth graders convert the price of US stamps to those of a number of foreign currencies. They use conversion charts to make the changes.
Curated OER
Fishkill
Students analyze data to determine the effect of thermal pollution on a certain species of fish. They graph temperature and dissolved oxygen and make inferences on the impact a change in temperature could have on the fish. As a class...
Curated OER
Bacteria Buddies
Tenth graders grow two different bacteria cultures. They count the colonies, and then use graphing calculators to predict the number of colonies that are going to appear. Students answer questions from their worksheet after completing...
Curated OER
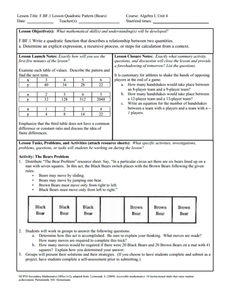
Bears
Young scholars complete a variety of bear-related activities. They sort and graph teddy bears, distinguish between real and non-real bears and research bear life cycles and habitats.
Curated OER
Ya' Gotta Have Heart
Fourth graders study the parts of the human circulatory system and how they function. They design a flow chart of the circulatory system and use data to construct charts and graphs.
Curated OER
Problem-Solving Strategies in Word Problems
Students examine how to determine which strategy to use to solve word problems. In this word problem strategy lesson, students listen to a lecture on the process of using different strategies to solve math problems. They look at guess...
Curated OER
Temperature Probe
Fourth graders perform activities that involve electronic measurements through probe software. Students collect data and create a variety of visual formats: graphs, charts, tables, and gauges. They compare and contrast their data to...
Curated OER
BEETLES: The Coming Out
Young scholars design an experiment to test the variables involved in the hatching of the Bruchid beetle.
Curated OER
Schoolyard Bird Project
Students observe and count bird sightings around their schoolyard throughout the school year.
Curated OER
Introduction to Scatter Plots and Correlation
Students examine the concept of scatter plots. They compare baseball statistics to locate the ones that correlate with winning, and identify the positive, negative, and no correlation in sets of data using MS Excel.
Other popular searches
- Charts Graphs and Tables
- Tables, Graphs, Charts
- Graphs Charts Tables
- Maps, Charts, Graphs, Tables
- Charts, Tables, Graphs
- Charts, Graphs and Tables


