Curated OER
Reading Immigration Graphs and Charts
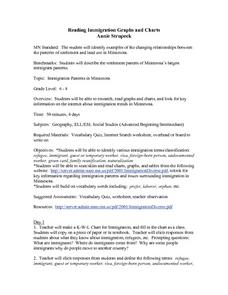
Students examine the settlement patterns and land use in Minnesota. In groups, they practice reading immigration graphs and charts and discuss why immigrants settled where they did. They are also introduced to new vocabulary related to...
Curated OER
Organizing Data Using Tables and Graphs
Learners create graphs and tables, as well as interpret and make inferences from the data shown to determine when and where graphs and tables are most useful.
Curated OER
Make a Table
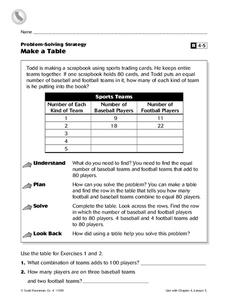
In this charting activity, 4th graders complete a table. Using the information provided, students fill in the missing data and complete 2 short answer questions.
Curated OER
Using A Table
In this table activity, learners observe information in a table, and then answer ten questions pertaining to the information. They must correctly read a table in order to arrive at the correct answer. Questions pertain to features of a...
Curated OER
Table Readings
In this table worksheet, students read questions and interpret tables. Questions include information concerning unemployment, oil imports, and foreign students. This multiple-choice worksheet contains 10 problems. Answers are provided.
Curated OER
Charting and Graphing Sales
Students analyze and represent weekly sales figures using tables, bar graphs, and pie charts. They draw conclusions using bar graphs and pie charts. Students are told that each day at school they have the option of buying or bringing a...
Curated OER
Charting and Graphing Sales
Students analyze graphs, charts and tables. In this data analysis lesson plan, students practice creating and analyzing charts, graphs and tables corresponding to sales and surveys. This lesson plan uses data relevant to students and...
Curated OER
Graphing
Learners collect data to create different types of graphs-line, pie, and bar graphs. They use StarOffice 6.0 to create graphs.
Curated OER
Data and Probability: What is the Best Snack?
In this math/nutrition lesson, the nutritional value of 3 snack foods is recorded on a data chart and represented on a bar graph. Students analyze and compare information, construct data charts and related bar graphs, and draw...
Curated OER
Unit 6b -Year 5
If you have some 9-10 year olds who are ready for some 5th year math, then check out this UK math unit. There are 172 slides that cover all of the basic multiplication tables, relate those to division, fractions, sequencing, and an...
Curated OER
Regents High School Examination PHYSICAL SETTING CHEMISTRY 2007
The University of the State of New York has designed a series of exams to be given to high schoolers. This chemistry exam is one of the most comprehensive and well-written that you will ever find. It consists of 84 questions in a variety...
Curated OER
Data Handling
In this data handling worksheet, students interpret data found in table, graphs and charts. They organize data and draw bar charts. This two-page worksheet contains 2 multi-step problems.
Curated OER
Graphing with Stems-and -Leafs
Fourth graders examine the use of stem and leaf graphs. For this stem and leaf graph lesson, 4th graders participate in teacher led lesson showing the use of the graphs. They work in groups to collect data about peanuts before making a...
Curated OER
Application of Graph Theory
Students investigate different online tutorials as they study graphing. In this graphing lesson, students apply the concept of graphs cross curricular and use it to make predictions. They define the purpose and theories behind graphs.
Curated OER
Graphing With Candy
Students gather information and interpret the results using a tally chart, a table, and a bar graph.
Curated OER
Fruit Loop Graphing
Fifth graders interpret data and create graphs. Given Fruit Loops, they sort and classify according to color. Using spreadsheet technology, 5th graders record their data and create bar and circle graphs. Students analyze data and...
Balanced Assessment
Cost of Living
Math scholars investigate the cost of living in Hong Kong compared to Chicago but must first convert the different types of currency. They then choose a type of graph to compare different spending categories and finish the activity by...
Willow Tree
Histograms and Venn Diagrams
There are many different options for graphing data, which can be overwhelming even for experienced mathematcians. This time, the focus is on histograms and Venn diagrams that highlight the frequency of a range of data and overlap of...
Curated OER
Frequency Tables; Discrete Ungrouped Data
For this frequency tables worksheet, students utilize given data to work out three frequency charts with one containing values and a pie chart involving angles for each value. Students complete three vertical line diagrams and check all...
Curated OER
Frequency, Histograms, Bar Graphs and Tables
In this frequency instructional activity, students interpret histograms, bar graphs and tables. They examine frequency charts and comparison line graphs. This three-page instructional activity contains 4 problems. Answers are provided...
Curated OER
Making and Interpreting Tables
In this data tables worksheet, students make and interpret data tables given data about magazine sales. They categorize their data, complete their data table and answer questions about their data.
Curated OER
Comparing Data on Graph A and Graph B
Second graders gather and graph data. In this graphing lesson plan, 2nd graders collect data and graph this information using tally charts, bar graphs, pictographs, or tables. They make predictions about the outcomes.
Curated OER
Tables, Charts and Graphs
Students examine a science journal to develop an understanding of graphs in science. In this data analysis lesson, students read an article from the Natural Inquirer and discuss the meaning of the included graph. Students create a...
Curated OER
Reading and Making Pie Graphs
In this pie graphs worksheet, students solve 10 different problems that include reading a pie graph. First, they use the pie graph to respond to 5 questions that follow. Students determine the year that had the smallest and largest...
Other popular searches
- Charts Graphs and Tables
- Tables, Graphs, Charts
- Graphs Charts Tables
- Maps, Charts, Graphs, Tables
- Charts, Tables, Graphs
- Charts, Graphs and Tables


