Curated OER
Tables, Charts and Graphs
Students examine a science journal to develop an understanding of graphs in science. In this data analysis lesson, students read an article from the Natural Inquirer and discuss the meaning of the included graph. Students create a...
Curated OER
Application of Graph Theory
Students investigate different online tutorials as they study graphing. In this graphing lesson, students apply the concept of graphs cross curricular and use it to make predictions. They define the purpose and theories behind graphs.
Curated OER
Exploring an Atlas
Students explore global geography by participating in an atlas activity. In this countries of the world lesson plan, students collaborate in small groups and analyze an atlas while researching continents, countries and demographics....
Curated OER
Hopes and Dreams: A Spreadsheet Lesson Using Excel
Fourth graders read "The Far Away Drawer" by Harriet Diller and discuss the story as a class. After discussion, 4th graders create a t-shirt GLYPH about their hopes and dreams,share their information with the class and create spreadsheets.
Curated OER
What Are Alternative Fuels? Concept Mapping Alternative Fuels Investigation
Students compare and contrast the different types of alternative fuels. They create a concept map to understand their classification. They examine the properties of matter and energy as well.
Curated OER
A Research Project and Article For the Natural Inquirer
Get your class to use the scientific process to solve a scientific problem. They utilize the Natural Inquirer magazine to identify a research question which they write an introduction to and collect data to answer. They use graphs,...
Mathed Up!
Negative Numbers
Individuals read tables with temperatures and times in order to distinguish the town with the lowest temperature or most extreme temperature difference. Each of the eight questions has three sub-questions that use the same charts.
Curated OER
Where's the Barbecue?
Learners identify the major landforms, regions and rivers on a map of South Carolina. They compare the locations of the major Native American groups in the state as well. They chart where barbecue restaurants are located and write...
Curated OER
Graphing Regions: Lesson 2
Students identify and analyze geographical locations of inventors. They each identify where their inventor is from on a U.S. map, discuss geographic patterns, and create a t-chart and graph using the Graph Club 2.0 Software.
Curated OER
What's the Matter? (Grade 3)
Third graders organize information about the three types of matter and to reinforce concepts learned in the matter unit of the science curriculum. They use Inspiration software to create a concept map of the three types of matter.
Curated OER
Aquifer Model
Students, after researching and brainstorming about aquifers and locating aquifer maps of Texas, participate in the building of a model of an aquifer complete with a pumping station. They also answer a variety of questions at the...
Ontario
Reading Graphic Text
Do students really need to be taught how to read cartoons, comic books, and comic strips? Yes. Just as they need to learn how to read other forms of graphic text such as diagrams, photos, timetables, maps, charts, and tables. Young...
Curated OER
Population Density
Students examine world population density and population distribution. They create pie charts showing population distribution and analyze population patterns in the United States and major regions of the world. They identify...
Curated OER
Where Are the Bugs?
Students trap, collect and identify arthropods in a newly created desert tortoise preserve area over a period of one school year. They determine the rate at which various arthropods take up residence in the newly landscaped area. Data is...
Curated OER
Molecular Biology and Primate Phylogenics
By counting differences in amino acids, biology stars examine the relationships between different primates. With information gleaned, they map out a phylogenic tree and discover common ancestry. You will need to create printable versions...
Curated OER
Indian Women in Texas History
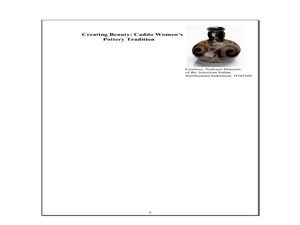
Fourth graders study Indian women in Texas. In this US history instructional activity, 4th graders discuss what each Indian woman's contribution was by completing a timeline and table. Students examine the Caddo Women's pottery tradition...
Curated OER
Landscape Diversity in the Yukon Territory
Pupils review and analyze a satellite image of the Yukon territory.
Curated OER
Blowing in the Wind
Pupils identify and interpret maps, graphs, charts, tables and political cartoons. Students identify what a compass rose is and review its meaning in relation to standard directions. Pupils design their own weathervanes. Students pencil...
Curated OER
My Family Tree
Students create a family tree. In this ancestry lesson plan, students research a country that one of their ancestors is from. Students interview a grandparent and map out a family tree.
Mark Twain Media
Understanding Informational Text Features
Everything you need to know about informational text features can be found in this resource. Recognizing these types of text features and how they are used in text allows readers to better understand information. Teachers can use this as...
Curated OER
Carbondale: The Biography of a Coal Town
Students use a brief history of the growth and decline of the anthracite region in the state to create a photograph and map "peak shaped" time line. They practice map and photo analysis strategies to "read" photographs and maps.
Curated OER
Geography And The Gulf War
Young scholars develop maps, tables, graphs, charts, and diagrams to depict the geographic implications of current world events, and analyze major human conflicts to determine the role of physical and cultural geographic features in the...
Curated OER
Analyze This
Students gain practice in the analysis of various types of graphs common in daily life. These examples often use graphic images like charts, graphs, tables, and pictures to supplement learning.
Curated OER
Ocean Currents and Sea Surface Temperature
Students use satellite data to explore sea surface temperature. They explore the relationship between the rotation of the Earth, the path of ocean current and air pressure centers. After studying maps of sea surface temperature and ocean...


