West Contra Costa Unified School District
Writing Exponential Functions Based on Data
Give your class a concrete example of exponential growth and decay using this hands-on activity. These Algebra II lessons allow for the exploration of exponential growth and decay models, as well as the discovery of the patterns of each....
Virginia Department of Education
Molar Volume of a Gas
What is a chemist's favorite plant? Stoichiome Tree! Scholars produce hydrogen gas by reacting magnesium with hydrochloric acid. Then they calculate the molar volume of the gas produced before answering assessment questions.
West Contra Costa Unified School District
Law of Sines
Laws are meant to be broken, right? Learners derive the Law of Sines by dropping a perpendicular from one vertex to its opposite side. Using the Law of Sines, mathematicians solve for various parts of triangles.
University of Georgia
Freezing and Melting of Water
Examine the behavior of energy as water freezes and melts. An engaging activity provides a hands-on experience to learners. Collaborative groups collect data and analyze the graphs of the temperature of water as it freezes and then...
American Statistical Association
Don't Spill the Beans!
Become a bean counter. Pupils use a fun activity to design and execute an experiment to determine whether they can grab more beans with their dominant hand or non-dominant hand. They use the class data to create scatter plots and then...
Curated OER
My Antonia: K-W-H-L Strategy
Use the well-known KWHL chart as a tool for building up to a research project and oral presentation related to Willa Cather's My Antonia. Starting with a class brainstorm, pupils research and gradually narrow down topics relating to...
Curated OER
Mound Math
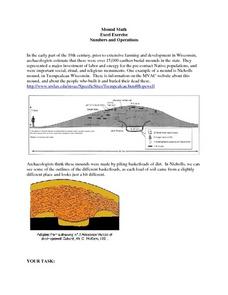
Students examine the many different burial mounds in Wisconsin. In groups, they use the internet to discover how long it took to build a specific mound. They must calculate the measurements of the mound to make a scale model.
Curated OER
Stock Market Game
Fourth graders are introduced to how the stock market operates. In groups, they practice reading and analyzing the Standard and Poor's 500 index. They participate in a simulation of buying and selling stocks on the market trying to...
Curated OER
Golden Ratio
Tenth graders investigate the Golden Ratio. For this geometry lesson, 10th graders explore the Fibonacci sequence in the context of The Fibonacci Rabbit problem. Students examine how the ratio of two consecutive Fibonacci number create...
Curated OER
Reference Resources: Being a Good Detective
Learners explore a variety of reference resources while seeking information. atlases, almanacs, dictionaries, encyclopedias, thesauri, and online search engines as well as library card catalogs are utilized in this instructional activity.
Curated OER
Following a Recipe
Students create a cookbook. In this recipe and writing lesson, students brainstorm the skills necessary to follow a recipe, watch a cooking show and write down a recipe used. Students use a word processing program to write a paragraph...
Curated OER
Data! Data! Graph that Data!
Fifth graders create data graphs using Microsoft Excel. In this data collection instructional activity, 5th graders create and conduct a survey, then use Excel to organize and graph their data.
Curated OER
Pumped Up Gas Prices
Learners calculate gas prices. In this transportation lesson, students tally the mileage and gas costs of their car for one months. They figure out how much was spent on gas and create a graph showing average gas prices over time.
Curated OER
Smarty Pants
Students graph the colour distribution found in a packet of Skittle lollies, M&M's, Smarties or similar sweets. Results are compared and recorded against the results of other class members.
Curated OER
Singular and Plural Nouns 2
In this singular and plural nouns worksheet, students complete fifteen sentences using either 'is' or 'are' in them to make them grammatically correct.
Curated OER
I Can Do This! Systems of Equations
Students solve systems of 2-by-2 linear equations using tables,
graphs and substitution. In small groups, classmates work together to discover strategies for solving equations. They use a calculator to graphically represent their answers.
Curated OER
Histograms and Statistical Graphics
In this statistics worksheet, students solve 6 data problems. They construct a histogram of given data, they create a frequency polygon, and a stem and leaf diagram. Students create a dot plot and a pie chart for given data sets. On the...
Curated OER
Atoms
Eighth graders explain what makes up matter. In this atoms lesson plan students define an atom and what its components are and identify properties of elements.
Curated OER
Pump Up the Volume
Fourth graders calculate volume. In this volume lesson, 4th graders calculate, estimate, and compare units of volume in English and metric systems.
Curated OER
Using a Spreadsheet
Young scholars create a spreadsheet to analyze data. In this technology lesson, students develop and use an Excel spreadsheet to log their data. They solve real life word problems as they set it up using the spreadsheet.
Curated OER
Salinity
Learners define and discuss salinity, conduct classroom experiment to determine salinity of water sample by using hydrometer, record predictions, and demonstrate understanding of how salinity influences object's ability to float in water.
Curated OER
What is a Dictionary?
Second graders explore the purpose of a dictionary. In this library media activity, 2nd graders explore My First Dictionary and identify guidewords, entry words, and captions. Students list ways they can use the dictionary.
Curated OER
Reading Lesson Plan
Tenth graders read the poem "Still I Rise" and discuss the different ways it can be told and read and brought to life. In this poetry lesson plan, 10th graders read aloud and silently, and compare different works of poetry.
Curated OER
Graphing Linear Functions
Seventh graders identify the use of a function.They are asked to describe the input and output of a function. Students also identify different aspects of the coordinate system and represent functions in a visual graph.


