Curated OER
Debate the Daily Dilemma
Have your class practice their persuasion skills by participating in a class debate. They will discuss a dilemma and detail each point of view. Divided into both sides of the argument, they work in groups to create a well-rounded...
Curated OER
Math Mediator Lesson 10: Slope
Students explore the concept of slope. In this Algebra I lesson, students investigate the definition of slope as rise over run or change in y compared to change in x. The lesson includes a real-world problem in which the height of high...
Curated OER
Cyber Bullying
Cyber bullying is an important topic to address with middleschoolers. Here, learners take an active role in identifying and discussing this issue. Reviewing this resource with your class will help to equip them to be a part of the...
Curated OER
Communication Skills: Special Education
Get to talking with your special needs class. In pairs, they take turns telling each other where to go on a schematic map. They work to ask questions, answer questions, and check if their partner understands their directions, or if he...
Curated OER
PhysioEx: Chemical and Physical Processes of Digestion
In this anatomy worksheet, pupils complete 22 review questions in the format of short answer, table completion, and fill in the blank after finishing an online virtual experiment about the chemical and physical processes of digestion.
Curated OER
Charting the Discovery of the Americas
Students create chart using Microsoft Word depicting how trade led to the exploration of different regions of the world.
Curated OER
The Effects of Light Intensity and Wavelength on the Rate of Photosynthesis
Students use an on line website to simulate the effects of light intensity and wavelength on photosynthesis. In this photosynthesis lesson plan, students determine how wavelength of light and intensity of light affect the rate at which...
NASA
Connecting Models and Critical Questions
Scholars use data to analyze and determine which sets of information need to be counted. They create a model to explain differences among chemical elements using graphs to prove concept mastery.
Statistics Education Web
First Day Statistics Activity—Grouping Qualitative Data
Making groups of groups can help to organize data. Classes use statistics to group themselves using descriptive adjectives. The objective is for learners to understand that grouping qualitative data is useful when the original groups are...
Discovery Education
Sonar & Echolocation
A well-designed, comprehensive, and attractive slide show supports direct instruction on how sonar and echolocation work. Contained within the slides are links to interactive websites and instructions for using apps on a mobile device to...
West Contra Costa Unified School District
Search and Rescue Activity
Get your classes moving and practicing sequences at the same time! Learners move about the room solving problems and finding their solutions. Problems include both recursive and explicit formulas and both geometric and arithmetic sequences.
PricewaterhouseCoopers
Paying for College: Understanding Financial Aid Options
With many options to pay for college, middle schoolers learn about each possibility and that continuing their education is worth the investment. They discover the difference between a grant and a loan and that some expensive colleges may...
Curated OER
Bias in Statistics
Students work to develop surveys and collect data. They display the data using circle graphs, histograms, box and whisker plots, and scatter plots. Students use multimedia tools to develop a visual presentation to display their data.
Curated OER
PLANETS IN PROPORTION
Students discover scales for both the solar bodies' relative sizes and their distances from the sun. They find equatorial circumference and volumes of their solar bodies. Students apply estimation strategies and proportioanl reasoning to...
Curated OER
Calculating Volume in the Forest
Eighth graders use their knowledge of calculating the volume of cylinders to calculate the volume of trees. For this volume lesson plan, 8th graders identify why calculating the volume of cylinders would be valuable to a forester.
Curated OER
Colorful Fractions
Young scholars use charts to show fractions. In this fractions and percents lesson, students review fractions, percents and ratios. Young scholars create tables and color the cells to make different fractions. Students answer...
Curated OER
Ionic Chemical Formulas Days 1 & 2
Students study polyatomic ions and write binary and ternary ionic chemical formulas. They explore putting together different monatomic ions and coming up with as many chemical formulas as possible. They play a game similar to memory...
Curated OER
Geoboard Area
Students explore the basic geometric shapes and geometric shape vocabulary through the use of geoboards and virtual geoboards. They create a variety of shapes with a partner, build ten different rectangles on their geoboards, and...
Curated OER
Teams-Games-Tournaments
For this lesson, students play a game in order to understand and review the Delaware civic standards. Student take turns picking cards and the student to pick the first card gets to answer the question. Students are expected to compete...
Curated OER
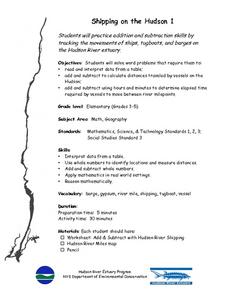
Shipping on the Hudson
Students track movements of ships, tugboats, and barges on the Hudson River estuary in order to practice addition and subtraction skills. They solve word problems by reading and interpreting data from a table. They calculate distances...
Curated OER
Get On Board
Students create a ticket table illustrating the cost of tickets by alternative transportation. In this number sense lesson, students write number sentences to compare and contrast difference information in their chart. Students figure...
Curated OER
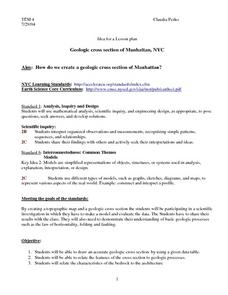
Geologic cross section of Manhattan, NYC
Students draw an accurate geologic cross section by using a given data table. They relate the features of the cross section to geologic processes. Students then relate the characteristics of the bedrock to the architecture.
Curated OER
Global Warming Statistics
Learners research and collect data regarding temperature changes for a specific location and find the mean, median, and mode for their data. In this climate change lesson plan, students choose a location to research and collect data...
Curated OER
Science as Inquiry: what is starch and how can we test it?
Sixth graders discuss nutrients and examine foods for starch. In this starch testing lesson, 6th graders use iodine to test foods for starch and record their results. Students complete a worksheet and self reflection.


