Curated OER
Spreadsheet Graphs
Students create graphs using information from spreadsheets. They select a topic from the following choices: website use, digital cameras, spreadsheets, calculators or educational software. They tally the class results and create an...
Curated OER
Balloon Graphing
Fourth graders explore data, charts and graphs. They create graphs using titles, labels, axes, intervals, and scale correctly. Students enter their data into Excel and create a graph.
Curated OER
Chucky Chickadee's Bird and Breakfast: Sing in Please
Students observe bird feeding and complete a tally and graphing activity for their observations. In this bird graphing lesson plan, students work in teams to observe bird feedings. Students complete a bird reporting sheet and collect...
Curated OER
A Turkey for Thanksgiving - Lesson #2
Second graders investigate realistic fiction, holiday celebrations, making tally charts. For this multi-disciplinary lesson, 2nd graders listen to a story about Thanksgiving and one about the Chinese New Year to develop an understanding...
Curated OER
Data Analysis
Students double check their data collections of Top 20 singles that they've been collecting for several days. Types of data is reviewed in detail and a variety of questions are asked for retention factors of mastery. They draw a tally...
Curated OER
Graphing Data
First graders learn how to display data using a bar graph. In this bar graph lesson, 1st graders use data from a t-shirt color survey to make a bar graph. They also make an animal bar graph before interpreting the information.
Curated OER
And the Survey Says...
Learners use technology to input, retrieve, organize, manipulate, evaluate, and communicate information; apply appropriate technologies to critical thinking, creative expression, and decision-making skills. They collect and explore data...
Curated OER
Organize Data
In this organizing data worksheet, learners complete the tally chart for 'Votes for Team Mascot' and then use the chart to answer the six questions.
Curated OER
Mathematics of Fair Games
Students examine mathematicians' notion of fairness in games of chance. They work in pairs to perform three different experiments using macaroni and paper bags. They record their results on charts and compare their data.
Curated OER
What Are Your Favorite Apples?
In this tally worksheet, students take a survey to determine the favorite apple. They write tally marks beside the apple chosen. For elementary students, this worksheet may be used for counting purposes and to reinforce what a tally mark...
Curated OER
Snack Attack
Students design charts, tables, graphs, and pictographs to analyse the types of snacks in a bag.
Curated OER
Graphing Favorite Fruit
Third graders take poll and sort data, enter the data to create a spreadsheet and create bar and pie graphs.
Curated OER
Tracking Down Traits
Sixth graders list traits that all sixth graders share. They receive worksheets "Tracking Down Traits," working in groups to complete the chart. Students share results with the class and a class summary is tallied. Students discuss the...
Curated OER
Pumped Up Gas Prices
Learners calculate gas prices. In this transportation lesson, students tally the mileage and gas costs of their car for one months. They figure out how much was spent on gas and create a graph showing average gas prices over time.
Curated OER
Microsoft Office Excel
Pupils use Microsoft Office Excel. In this technology activity, students enter data on a spreadsheet using Excel. This programs tallies data and presents it using graphs.
Curated OER
Working with Frequency Tables
In this Working with Frequency Tables worksheet, students analyze data that is organized in simple frequency charts. They calculate average from data presented in a frequency table, calculate a cumulative score, and identify data that...
Curated OER
Probability With a Random Drawing
Students define probability, and predict, record, and discuss outcomes from a random drawing, then identify most likely and least likely outcomes. They conduct a random drawing, record the data on a data chart, analyze the data, and...
Curated OER
Analyzing Health
Third graders analyze their health. In this analysis lesson plan, 3rd graders rate their health on a 1-10 scale. They then tally the scores from the class and create a data chart. Then they answer true and false questions based on...
Curated OER
Let's Flip a Coin
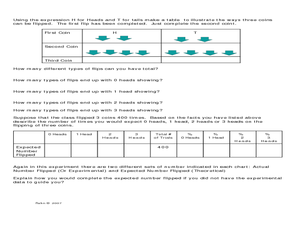
In this probability instructional activity, learners use a TI graphing calculator to simulate flipping a coin and compare their results (experimental probability) to the expected results (theoretical probability). The five page...
Curated OER
Graphing With Candy
Students gather information and interpret the results using a tally chart, a table, and a bar graph.
Curated OER
Shoeless Math
First graders sort and classify, and complete a T-chart using Students' shoes.
Curated OER
Smarties Investigation
In this math worksheet, students participate in an investigation of Smarties candy. For example, students estimate how many candies they have in each color, count the actual number, and record the information in a tally chart.
Curated OER
Mathematics of Fair Games
Students study about mathematicians' notion of fairness in games of chance. They work in pairs to perform three different experiments using macaroni and paper bags. They record their results on charts and discuss the fairness of the games.
Curated OER
Coin Probability
Fourth graders, in pairs, receive three different types of coin bags. They pick coins out of the bag and tally what was picked fifteen times. They do it with all three bags for three separate tallies.
Other popular searches
- Tally Charts and Pictographs
- Tally Charts and Tables
- Tally Charts or Pictographs.
- Math Tally Charts
- Primary Tally Charts
- Sorting and Tally Charts
- Tally Charts Mode
- Using Tally Charts
- Lucky Charms Tally Charts
- Birthday Tally Charts
- Tally Charts Lesson Plans
- Halloween Candy Tally Charts


