Curated OER
Favorite Food Survey Recording Sheet
In this favorite food survey recording worksheet, students use the survey sheet to collect data about favorite foods. They fill in the name and favorite food of the people they survey.
Curated OER
Caring for a Pet
Students identify the responsibilities of pet owners. In this animal welfare lesson, students read the book Animals As Friends and list the characteristics of a good pet owner. Students use a tally sheet to determine what pets students...
Curated OER
Mystery Puzzle Race
Students work togeter and work on fitness by playing a game with 36 dome cones, 36 index cards, 6 jump ropes, tally sheets, 6 small clip boards and pencils, 6 hula hooops, and 6 regular cones.
Curated OER
Dewey Decimal Game
Engage all the upper elementary classes in your school in a game to learn Dewey Decimal Classification. On 5 or 6 consecutive visits to the library, teams from each class learn how the system works, locate books in each category, and...
Curated OER
The Die Is Cast
Second graders use tally marks to tabulate and count the number of times each number on a die is rolled.
Curated OER
Displaying the Data
Learners gather facts about their parent's families through the completion of parent interview forms. Using tally marks, the data gathered is counted, transferred to graphs and used to create family timelines.
Beacon Learning Center
Spotted Stones Linked Just Right
Discover how to play the game of dominoes using mental math skills to solve equations that earn points. Pupils become fast critical thinkers in determining which unknown addend tally up points in their favor.
Curated OER
Data Analysis Challenge
In this data analysis worksheet, young scholars work with a partner to collect information for a survey. The information is then compiled into a graph. Students must indicate their survey question, the target audience, predict the...
Missouri Department of Elementary
How We Are Alike And Different
Scholars develop social awareness by exploring the concept of similarities and differences. Learners examine two beverages and use a Venn diagram to identify similarities and differences. They tally each item to identify if they are more...
Curated OER
Mississippi Trial, 1955: Anticipation Guide
As an introductory activity to Mississippi Trial, 1955, class members use color-coded dots to respond anonymously to a series of statements about prejudice and responsibility to their fellow-man that are posted about the room. The...
Chicago Botanic Garden
Calculating Your Carbon Footprint
Unplugging from technology for one day per week will decrease your carbon footprint—are you up to the challenge? Part two in a series of three allows individuals to explore their personal carbon footprints. By first taking a quiz at home...
Shodor Education Foundation
Two Colors Applet
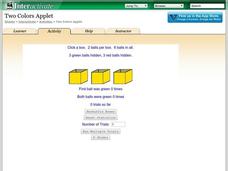
Find the box with two green balls. The applet uses six balls, three green and three red, and hides them in three boxes. Pupils choose a box and click on it to reveal the color of balls inside. Using the chosen box, the simulation keeps...
Curated OER
Chucky Chickadee's Bird and Breakfast: Sing in Please
Young scholars observe bird feeding and complete a tally and graphing activity for their observations. In this bird graphing lesson, students work in teams to observe bird feedings. Young scholars complete a bird reporting sheet and...
Curated OER
Pollinators at Work in The Garden
For this science related worksheet, learners are asked to visit a garden and record how many pollinators they notice and record their findings on the tally sheet provided.
Curated OER
Investigation-What are My Chances?
Second graders explore probability. In this math lesson plan, 2nd graders discuss the possibility of choosing a certain colored tile from a bag. Students perform experiments and describe the outcomes as certain, possible, unlikely and...
Curated OER
And the Survey Says...
Students use technology to input, retrieve, organize, manipulate, evaluate, and communicate information; apply appropriate technologies to critical thinking, creative expression, and decision-making skills. They collect and explore data...
Curated OER
Working with Spreadsheets
Learners integrate physical education and technology. They give their best during jogging time and keep tally of the number of laps they run during their jogging time each day. They record this on a tally sheet and enter a formula which...
Curated OER
One Out of Six
Students investigate basic concepts of chance and probability. They make a number cube to predict which number might be rolled the most often out of 20 consecutive rolls and tally the results. Number cube template included.
Curated OER
Surveying During a Basketball Game
Tenth graders conduct a survey at a high school basketball game. They compile and present the data as histograms or bar graphs.
Curated OER
Buzzing is BEE-lieving
Students investigate insects. In this insect activity, students explore various insect models and identify the characteristics of each. Students observe insects outside and tally how many insects they observe.
Curated OER
Show Me the Money
Students review the terms in the "Money Vocabulary Word Bank." They make a wallet or purse to keep their money in. Students learn the song "Show Me the Money." They participate in five centers: 1) Head or Tails Tally, 2) Piggy Bank...
Curated OER
A Class Census
Students recognize that data represents specific pieces of information about real-world activities, such as the census. In this census lesson, students take a class and school-wide census and construct tally charts and bar graphs to...
Curated OER
Let's Talk Trash
In this solid waste worksheet, learners classify the different types of solid wastes found in landfills into given categories. Students predict and tally the total number of each type of item found in the landfill using slips of paper....
Curated OER
What's your favorite physical fitness activity?
Fourth graders engage in a class discussion where they create a list of their favorite physical fitness activities. They tally the numbers on the board and use Microsoft Excel to create a spreadsheet and graph of the activities.


