Curated OER
Earth Day Trash Survey Unit
Learners develop a questionnaire to distribute via e-mail or Web page forms that visitors fill out based on the data they gathered during their clean-up activities.
Curated OER
The Great Backyard Bird Count
Students study new types of birds and explore how to keep a log of what they see.
Curated OER
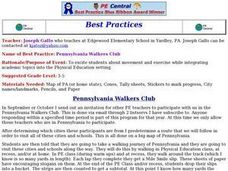
Pennsylvania Walkers Club
Students participate in an school-wide walking club. Students choose a destination in Pennsylvania they would like to visit. After plotting the best way to get their using a map, the walk each day and record their distance in miles on...
Curated OER
The Household Environment Survey
Students examine data collected from a national survey of household environmental practices to develop their own questionaires. Once they have their own survey questions, students conduct their own investigations, and report their findings.
Curated OER
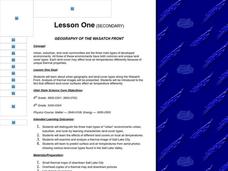
Geography of the Wasatch Front
Students identify the three main types of urban environments by learning characteristic land-cover types. They examine and analyze a thermal image of Salt Lake City. Then they predict surface and air temperatures from aerial photos.
Curated OER
What Do You Think About Radon?
Pupils complete a survey about radon in their homes. They calculate the averages for each question. They graph the averages and discuss the results.
Curated OER
Shape Hide and Seek
First graders identify different shapes. They participate in a game of hide and seek to find different shapes. They categorize the shapes as well.
Curated OER
Maps and Lines
In these organizing data worksheets, 5th graders complete four worksheets of activities that help them learn maps, graphs, and lines. Students then study images of maps, lines, and graphs.
Curated OER
Competing For Food
Young scholars examine the hunting and gathering aspects of the Washoe culture. They are assigned roles, and participate in a simulation of surviving through the seasons by competing for food with other people and tribes.
Curated OER
Favorite Farm Animals
Students perform a study of farm animals and their babies. They compile a graph of their favorite farm animals. They utilize a spreadsheet worksheet which is imbedded in this plan.
Curated OER
Graphing Our Favorite Candy Bars
Students use ClarisWorks to graph class' favorite candy bars on a bar graph.
Curated OER
Creating Graphs from Tables
Students interpret data from tables and then create a graph to show the same data in a different organization.
Curated OER
Paper Parachutes
Students participate in a simulation of a parachute-jump competition by making paper parachutes and then dropping them towards a target on the floor. They measure the distance from the point where the paper parachute lands compared to...
Curated OER
Let's Travel!
Students review the rules and expectations, they earn points each day by making the correct behavioral choices. They read maps and do Internet reserach, students become aware of United States and or world geography. Students check...
Curated OER
Whirlybirds
Young scholars measure to the nearest centimeter, and predict the frequency of an event. In this statistics lesson, students participate in a simulation of a parachute jump competition by making paper Whirlybirds, and then dropping them...
Curated OER
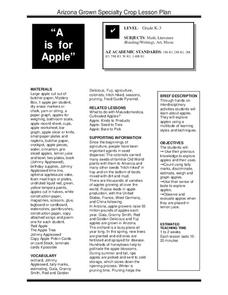
A is for Apple
Students participate in a variety of activities to learn about apples. Students graph apples, learn about apple uses, taste apples, and observe what happens when apples are dipped in lemon juice.
Curated OER
M&M Math
Students research number values by participating in a candy exercise. In this math function lesson, students utilize baking ingredients to create cookies and multiply how many M&M's will go into the batch if you want a certain amount...
Curated OER
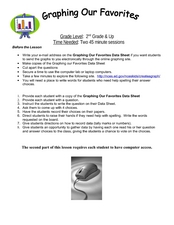
Graphing Our Favorites
Second graders use a computer program to follow directions and graph their favorite things into a bar graph. For this graphing lesson plan, 2nd graders have 30 choices of favorite things to graph.
Curated OER
Track and Field Olympics
Middle schoolers practice the long jump, the triple jump, the shot put, the hammer throw, and the 50 yard sprint in a mock Olympic track and field competition.
Curated OER
Candy Colors: Figuring the Mean, Median, and Mode
Students count candy by color and then calculate mean, median, and mode. They count candy and use the data to calculate mean, median, and mode (by color) and apply their learning to another collection of data.
Curated OER
Pretzel Math
Students demonstrate grouping pretzels into twos, fives and tens, then eat their groups of pretzels! After a lecture/demo, students work in groups practicing the proper grouping.
Curated OER
Climate Change
Students define and associate words with the topic of climate change while completing associated worksheets. They read and discuss articles about climate change including the effects of global warming and the greenhouse effect.


