Teach Engineering
Clay Boats
Clay itself sinks, but clay boats float. Why? Young engineers build clay boats to learn about buoyancy. They test the weight the boats can hold using washers and then tweak their designs to make improvements, following the engineering...
Polar Trec
Animal Monitoring Introduction
Not only do mealworms taste great, they are also great for classroom science lessons. In pairs, young scientists observe and record what they see as they check out what their mealworms are doing from minute to minute. Each minute...
Scholastic
Study Jams! Equivalent Fractions
Submarine sandwiches not only taste good, they also make for great math models. Follow along as Zoe explains how to calculate equivalent fractions, while cutting up a sandwich for herself and her friend. She demonstrates the process...
Statistics Education Web
10,000 Steps?
Conduct an experiment to determine the accuracy of pedometers versus pedometer apps. Class members collect data from each device, analyze the data using a hypothesis test, and determine if there is a significant difference between the...
Curated OER
Exploring Learned and Innate Behavior
Learners explore the differences between learned and innate behavior among humans and monkeys. They complete an assignment and read articles about two studies, which used similar test methods to show that infants and monkeys share an...
Curated OER
In Touch with Apples
Students read "How To Make an Apple Pie and See the World", the story of a girl who traveled the world to find the ingredients to make her apple pie. They conduct a series of interdisciplinary activities including testing their senses,...
Agriculture in the Classroom
Seed Match
Using this resource, your team of green thumbs discuss why plants are a part of a healthy diet and the different ways they are used in daily life. They then observe the characteristics of different seed as they attempt to match them with...
Curated OER
Figures of Speech: Quiz 2
Hyperbole, simile, metaphor, and personification are spotlighted on an online/interactive quiz. Test takers read short passages and then identify the figures of speech used.
American Statistical Association
How Long is 30 Seconds?
Is time on your side? Pupils come up with an experiment to test whether their classmates can guess how long it takes for 30 seconds to elapse. They divide the class data into two groups, create box-and-whisker plots, and analyze the...
Curated OER
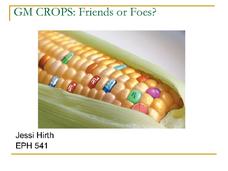
GM Crops: Friends or Foes?
Genetically modified crops—How do you feel about them? Here, explore the benefits and risks of GM crops to inform your opinion.
Nemours KidsHealth
Food Labels: Grades 3-5
Bring awareness to the ingredients scholars ingest daily with two lessons that look deeply into food labels. The first lesson plan explores the difference between processed and fresh foods while the second lesson plan focuses on sugar...
Statistics Education Web
Text Messaging is Time Consuming! What Gives?
The more you text, the less you study. Have classes test this hypothesis or another question related to text messages. Using real data, learners use technology to create a scatter plot and calculate a regression line. They create a dot...
Curated OER
A Tasty Experiment
Students work together to determine if smell is important to being able to recongize food by taste. They try different foods with different textures and hold their nose. They create a graph of their results.
Curated OER
Tongue Map
Young scholars explore human anatomy by conducting a human senses experiment. In this taste lesson, students identify the main purpose of a tongue and how it enhances our eating habits. Young scholars utilize baking coca, lemon juice,...
Curated OER
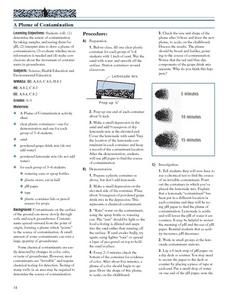
A Plume of Contamination
High schoolers perform an experiment/investigative simulation regarding the movement of contaminants in groundwater. They test the pH of three water samples, and then use their reasoning skills to determine the source of an invisible...
Curated OER
Creating and Reading a Pictograph
Second graders examine how data can be transferred into pictures on a pictograph. They analyze data on a graph about chewing gum, and create a pictograph that illustrates data about their preferences for the taste of bubble gum. ...
Curated OER
My Peanut Butter is Better Than Yours!
Young scholars explore the concept of statistical data. In this statistical data lesson, students read an article about the dangers of peanut butter to those who are allergic. Young scholars perform a taste test of two different brands...
Curated OER
International Festival: Germany
Learners complete several activities to learn about the German culture. In this German culture lesson, students read the 'Hansel and Gretel' story and create a paper gingerbread house. Learners complete a matching game for the story....
Curated OER
Fruits and Veggies More Matters: Teen Lesson
Students study the importance of increasing their fruit and vegetable consumption. In this healthy diet lesson, students study the benefits of eating fruits and vegetables based on their age, sex, and activity level. Students list three...
Curated OER
Apples, Apples, Apples
Students complete activities using apples that help improve their science, math, and reading skills. In this apple activity, students read the book Apples, Apples Apples and visit an orchard or farmer's market to buy a variety of apples....
Curated OER
Experimenting with Peanuts
Students investigate peanuts. In this science lesson, students explore the properties of the peanut and shell. Students burn a peanut to observe the peanut oil. Students taste test different types of peanut butter.
Curated OER
What's Cooking?
Students investigate solar energy by making sun tea. In this ecology and solar energy lesson, students prepare traditional tea and "sun" tea, then record and graph data comparing color, clarity, smell and taste.
Curated OER
A Tasteless Tasty Test
Students review the inheritance patterns of simple dominant and recessive traits in humans. They use PTC tasting as a model trait. Each student determines whether or not they are a taster using PTC paper then they compile and discuss the...
Curated OER
pH Testing
Students explore the use of variables in the scientific method. They identify the dependent and independent variables through pH testing. Students construct graphs of their data and analyze their findings.
Other popular searches
- Food Taste Test
- Applesauce Taste Test
- Apple Taste Test
- Scientific Method Taste Test
- Water Taste Test
- Taste Test Tongue
- Taste Test Marketing
- Taste Testing Activity
- Cookie Taste Test
- Marketing Soda Taste Test
- Taste Test for Bias
- Taste Testing


