Curated OER
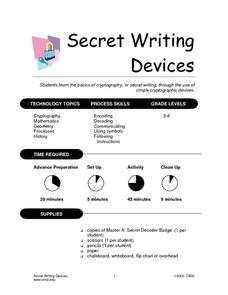
Secret Writing Devices
Elementary and middle schoolers explore the world of secret writing, otherwise known as cryptography. After an interesting introduction to the activity, learners utilize a decoder badge which uses the St. Cyr cipher - which is a cipher...
Curated OER
Quarter Conservation
Here is another in the interesting series of lessons that use the special State Quarters as a learning tool. This one uses the California State Quarter. During this lesson, pupils learn the many ways they can conserve natural resources...
Curated OER
Using Your Senses
Here is a terrific lesson that uses a special State Quarter as a learning tool. This one uses the Alabama State Quarter. During this lesson, pupils learn about their five senses. They make observations about what is in paper bags using...
Curated OER
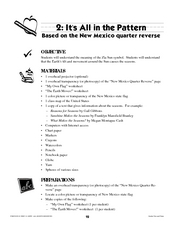
It's All in the Pattern
Here is a fantastic, nine-page, multi-session lesson plan on the Zia Sun Symbol (found on the New Mexico state flag), and the seasons of the Earth. Everything you need to implement the instructional activity is here, and the many...
Curated OER
Simple Strategies
Here is a fabulous lesson plan on problem solving strategies for your charges. In it, learners are presented with many excellent techniques they can use when faced with a multi-step math word problem. Some terrific blackline masters are...
Curated OER
Slowly But Surely
The US mint has created this fabulous lesson plan, which practices language arts and mathematics skills. Learners will use the provided worksheets and step-by-step instructions to experiment with different sentence structures, use...
Scholastic
Writing to a Historical Poet
Poetry is a very personal and introspective art form. Give your class the opportunity to understand how a poet's voice can speak to them on a personal level, and that every reader can respond to an author differently. After a poetic...
Curated OER
Graphing With Paper and Computers
Fourth graders construct bar graphs. In this graphing instructional activity, 4th graders create bar graphs in connection with the story, The Copycat Fish. After creating the initial graphs on paper, students use MS Excel to create graphs.
Curated OER
Green Leaves
Third graders, after having conducted one experiment three times, record their observations results in a chart. They predict what hidden colors they believe that a leaf holds. Students record their predictions in their science note books...
Curated OER
Music Math: Create a Clapping Symphony (Plus Fraction Math)
Students read simple music to create a symphony of clapping (all grades). Plus fraction math for grades 5-up. They explain how musical notes relate to fractions and identify a variety of musical notes for example, whole, half, and...
Curated OER
Comprehension: Setting
Students discuss what setting represents. In this language arts instructional activity, students review the three elements of setting: where the story takes place, when does the story take place, and is it past, present, or future?...
Curated OER
Richmond Rules!
Third graders consider their town government, rights and responsibilities of individuals, and government services in the town of Richmond. students create a KWL chart. After viewing specified web sites, 3rd graders answer questions to a...
Curated OER
Keeping Warm
Fifth graders measure the temperature of water using a thermometer. They record the temperatures of water on a chart. Students use the temperature data to determine which materials are the best conductors of heat. They discuss their...
Curated OER
Multiplication
Fourth graders write down multiplication facts that are given orally by the teacher and then place playing pieces on the correct number of a bingo chart when a multiplication fact is stated. The winner is the one to fill a row...
Curated OER
Remarkable Reptiles
Students will develop a KWL chart with the class to assess prior knowledge. The students will be given five-ten minutes to individually fill out the Know and Wonder sections of their individual charts. They will then participate in...
Curated OER
Science: How Tall Are Plants
First graders investigate plant growth and examine what factors contribute to plant growth. They keep a class chart of plant growth and write about and illustrate their conclusions.
Curated OER
Plants Releasing Water
Third graders investigate how water is released from different plants into the atmosphere. They observe and investigate two types of plants with domed lids with condensation and communicate those observances and inquiries on an in-class...
Curated OER
Insects at Home
Fourth graders search their house and surrounding neighborhood for insects. They complete a chart that help students organize the name, physical description, location found, and any unique characteristics of the insect.
Curated OER
Probability
Sixth graders explore probability. They analyze a class chart and list the letters of the alphabet according to frequency. Using the data collected, they complete probability problems.
Curated OER
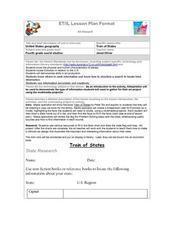
Train Of States
Fourth graders create a class book with information about each of the United States. After students draw a state name out of a hat, they use various resources to fill in a facts chart about their state. Students draw the state flag and...
Curated OER
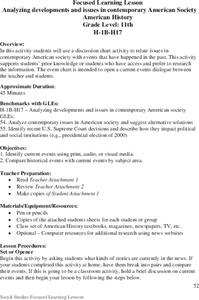
Focused Learning Lesson: American History
Eleventh graders use a chart to compare and relate events that have happened in the past to ones that are occuring now. If an event is unclear, they research it and add it to their chart.
Curated OER
McKinley Home Tour - Ohio
Students begin a KWL chart regarding what they would like to learn on the McKinley birthplace home tour. Students discuss their impression of life in the 1800s. Students tour the McKinley birthplace home in Niles, Ohio. They finish their...
Curated OER
Graphing
Fifth graders create graphs based on climate in South Carolina. They read and interpret information in a chart and construct a graphy from the information in the chart. They create a spreadsheet using Excel and publish 2 graphs.
Curated OER
Off to College
Students jog to where their classroom teacher went to college using a scale that best fits their situation. They log miles on a chart until students reach their destination. Students use the colleges mascot as the graph indicator as to...


