Curated OER
Grid Frame Mapping
Students map and describe small area of the schoolyard and discuss habitats.
Curated OER
If the World Were a Village...
Your class members explore concept that the world is a large place, examine how statistics can be used to help in understanding the world and its people, and create illustrations or graphs of statistics found in the award-winning...
Curated OER
TE Activity: A Tornado in My State?
Students study data about tornadoes in the United States while completing a worksheet. They develop a bar graph showing the number of tornadoes for the top ten states in the US. They find the median and mode of the data set.
Curated OER
Time/Elapsed Time
Young mathematicians complete various activities to demonstrate proficiency in telling time and identifying elapsed time. They analyze and discuss television schedules, create a booklet about their daily activities, produce a TV. guide,...
Curated OER
Population Growth in Yeasts
Students design an investigation using yeast. In this environmental engineering lesson, students design an investigation to determine how environmental factors affect the growth of yeast. They will collect quantitative data and discuss...
Curated OER
Attack of the Raging River
Students explore mass and volume. In this mass and volume lesson, students pretend to be on a hike and have lost their way. Students must cross a river get back on track. Students must use mass, volume, surface area, density, property...
Curated OER
Energy Conservation
Students investigate energy conservation. In this energy conservation and analyzing data instructional activity, students identify and explain several energy sources and research renewable and nonrenewable energy sources. Students use...
Curated OER
Let's Make A Deal
Third graders make a picture money book. In this money lesson, 3rd graders read The Monster Money Book, discuss money terminology, watch a video on money and draw an example of the barter system. Students use the Internet to find...
Alabama Learning Exchange
Imaginary Numbers? What Do You Mean Imaginary?
Don't worry, this resource actually exists. Scholars learn about imaginary numbers and work on problems simplifying square roots of negative numbers. As an extension, they research the history of imaginary numbers.
Alabama Learning Exchange
Color This Polynomial Simplified
Help learners use a variety of methods to identify, visualize, and simplify polynomials with like terms. Several different visuals are used to introduce the instructional activity, such as colored pencils, overheads, interactive white...
Curated OER
Place Value Review: Tens and Ones Place
Young learners determine the place value of a digit in a given number. They review 10s and 1s place value by participating in activities using unit blocks. Some excellent independent practice is built in to this plan. A written...
Curated OER
Rational Expressions: Simplifying
This two-day lesson will help the class simplifying rational expressions. It also has an emphasis on understanding when a rational expression is undefined. The lesson contains powerpoint presentations, worksheets, and answer key.
Curated OER
Skate Party
Learners use the Frayer model during problem solving. In this problem solving instructional activity, they examine multiple methods of data collection to solve real world problems. Resources are provided.
Curated OER
World of the Pond
Field trip! The class will review what they know about organisms that dwell in freshwater ponds, then trek down to the old water hole to collect specimens for examination. This includes several web links, useful tips, and an excellent...
Alabama Learning Exchange
Place Value Party
Help your young mathematicians master three-digit place value with a hands-on activity that builds on their social orientation. They create a place value house from construction paper and sort "number friends" according to which house...
Curated OER
How Far Is It?
Students use a map key to estimate the distance from Salt Lake City, Utah, to ten other cities. Then they use an online distance calculator to see how close their estimates come!
Curated OER
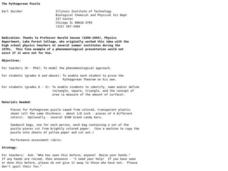
The Pythagorean Puzzle
An engaging hands-on activity is presented. Learners of all ages are addressed in thie unique plan. K-5 learners identify, name, and define a rectangle, square, triangle, and the concept of area. Older learners prove the Pythagorean...
Curated OER
Charting History With Pennies
Students collect pennies and sort them in ascending order of dates. For the year on each penny, students research key events in history and pick a single event, explaining its historical significance. Then students use these events to...
Curated OER
M&M Graphing
Youngsters sort M & M's by color. They graph the M&M's by color on a graph. This classic lesson is a wonderful way to introduce the concept and technique of graphing to young mathematicians. Pairs of kids can make up their own...
Curated OER
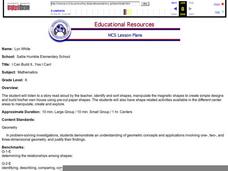
I Can Build It.....Yes I Can!
Kindergartners listen to a story read by their teacher, then use magnetic shape pieces to construct simple designes. They "build" their own house using pre-cut paper shapes. This age-appropriate lesson would be an excellent choice for...
Curated OER
Get in Shape with Geometry
Using geoboards, computer programs, and hands-on manipulative materials, elementary schoolers engage in a study of two and three-dimensional geometric shapes. This lesson is chock full of good teaching ideas on the subject, and the...
Curated OER
The Bean Growth Experiment
Fifth graders use modern technologies which allow them to gain a new, dynamic, and intersting understanding of themselves, their community, and the world. They focus on environmental education and the effect of the environment on plant...
Curated OER
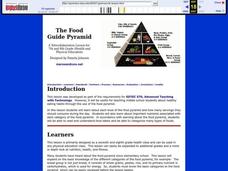
The Food Guide Pyramid
Students examine each level of the food pyramid and how many servings they should consume during the day. They study the important nutrients associated with each category of the food pyramid.
National Council of Teachers of Mathematics
National Debt and Wars
Take a functional approach to the national debt. Learners collect information about the national debt by decade and plot the data. They determine whether an exponential curve is a good fit for the data by comparing the percent changes...
Other popular searches
- Math Technology
- Educational Technology Math
- Immigrant Math Technology
- Math and Technology
- Math Technology Projects
- Math Assistive Technology
- Math Technology Triangles
- Math Technology Excel
- Computer Technology Math
- Surveys Math Technology
- Math Technology Lesson Plans
- Math Technology Lesson


