Curated OER
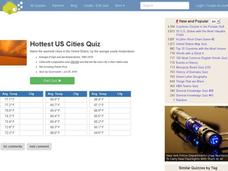
Hottest US Cities Quiz
In this online interactive geography quiz worksheet, students respond to 20 identification questions about the hottest cities in the United States. Students have 4 minutes to finish the timed quiz.
Curated OER
Air Pressure and Wind
Fifth graders study air pressure and learn how it can change the weather. In this air pressure lesson, 5th graders study the given diagrams and complete the experiments to learn how air pressure can change the weather. Students read...
Curated OER
Weather Patterns
Students collect weather data over a thirty day period to gain an increased understanding of the weather patterns in their area. Once the data is collected, students post their finding online using a web tool. Finally, students attempt...
Curated OER
Special Delivery-Opinion
Learners are introduced to the concept of global climate change. Using data, they determine how much of the world is being affected by the increase in temperatures. They complete a worksheet and consider the evidence giving to them and...
Curated OER
How's the Weather
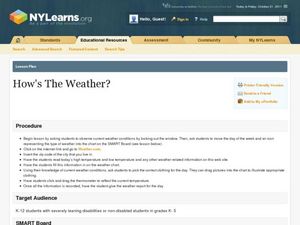
"How's the Weather?" is an exercise that combines science and math as students graph the weather along the Iditarod Trail. They complete a double-line graph of the weather of a chosen checkpoint over the course of one week. Students...
Curated OER
Succession and Microclimate
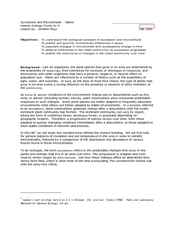
Students compare the population of insects in different microclimates. In this biology lesson, students collect data using probes to tabulate temperature and soil data. They predict how certain parameters change as an area goes through...
Curated OER
Specific Heat Capacity of a Metal
Eleventh graders investigate the relationship between heat and energy transfer. They review terms including heat, work, calorimetry and the procedures for an experiment. After assembling the materials for the experiment, they observe...
Curated OER
The Greenhouse Effect
Middle schoolers investigate the greenhouse effect and why it happens.
Curated OER
Weather Chart
Students select at least 6 cities from around the world to keep track of their high and low temperatures over a period of time.
Curated OER
Set the Stage
Young scholars observe evaporation in a controlled environment. Evaporation is the change of liquid water into water vapor (a gas). The rate of evaporation is determined by many factors such as air temperature and humidity, liquid...
Office of the New Jersey State Climatologist
Play Ball! – Or Not…Making a Decision Using Weather Data
Should the game go on or not? An engaging lesson asks small groups to make a decision using weather data. After analyzing a map, an updated forecast, and radar information, groups have to decide whether to cancel a baseball game. They...
Curated OER
Dissolved Oxygen and Respiration
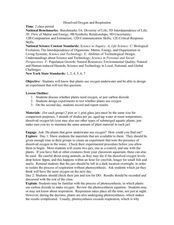
Students are presented with the question, "Do plants that grow underwater use oxygen?" They create an experiment to test the presence of dissolved oxygen in the water using provided materials. Student experiments include a control jar as...
Curated OER
Tides in the Hudson
Young scholars view an illustration of the Hudson River watershed and identify the bodies of water shown. They discuss what happens when fresh and salt water mix. Students view a teacher demonstration of the stratification of fresh and...
Space Race
Sensory Detectives
Test your learners' sensory awareness with three hands-on activities that ask pupils to use their other senses to identify and describe everyday objects hidden from sight.
Curated OER
Culture Regions of the U.S.
Students identify the location of different cultural groups within the United States (agricultural, retirement, urban, etc.) They map these areas and analyze the correlation between the landscape of a given region and the type of...
Curated OER
What If There's No Light?
students discuss the importance of light and the consequences of living without it. Using a plant as a demonstration, students predict and observe what happens to a plant when it does not receive enough light. In groups, they experiment...
Curated OER
A Tour Down the Hudson River
Students discuss how the Hudson River is an ecosystem made up of both biotic and abiotic factors. They view the PowerPoint the Journal Down the Hudson River. Students become aware of where the Hudson River begins and ends, the plant and...
Curated OER
Dissolved Oxygen Introduction
Students are shown how dissolved oxygen enters the water. They are taught the difference between a water sample that has been exposed to the air and one that has not. Students brainstorm what organisms need to survive. They use dissolved...
Curated OER
Zebra Mussel Population Simulation
Students are taught how to format and enter data into an Excel spreadsheet. They make a graph, and interpret graphed data. Students discuss the possible impacts of zebra mussels on the Hudson river. They graph zebra mussel data.
Curated OER
Water Chestnut Graphing Activity
Students are taught how to format and enter data into an Excel spreadsheet. They make a graph and interpret graphed data. Students discuss possible impacts of water chestnut invasion. They graph data on water chestnut. Students report...
Curated OER
Water Quality with Samples
Students recognize whether one wants to drink water, swim in it, or for the health of the organisms living in it. They prepare different water samples to observe and collect samples regarding the water quality.
Curated OER
Bottled Water vs. Tap Water
Students analyze the similarities and differences between tap water and bottled water. They make informed decisions about their use of each. Students are asked if they drink mostly tap water straight from the tap or water fountain. They...
Curated OER
Hudson Valley Rocks
Students identify each of the rocks provided and locate where in the valley they are found. They explain why the rocks came to be as they are in each location. In addition, they relate the exercise to how the Hudson Valley's geologic...
Curated OER
Glacial Groundwater
Students study glacial deposition and groundwater in Dutchess County, new York. They identify the permeability rates in different glacial deposits and relate this information to ground water capacity of sediments found in Dutchess...


