Curated OER
Heating Curve Lab
Tenth graders examine the heating curve of water when head is added constantly over time. They input values into a calculator as they record water temperature every thirty seconds as it is heated on a hot plate. They complete the...
Space Awareness
Oceans as a Heat Reservoir
Oceans absorb half of the carbon dioxide and 80 percent of the greenhouse gases released into the atmosphere. Scholars learn how and why the oceans store heat more effectively than land and how they help mitigate global warming. Pupils...
Space Awareness
The Thermal Layers of Oceans
How much does the sun heat up a lake or ocean? Scholars use a cup and a strong lamp to investigate the heat transfer and thermal layers in the ocean to come up with the answer. They collect data and graph it in order to better understand...
NOAA
A Quest for Anomalies
Sometimes scientists learn more from unexpected findings than from routine analysis! Junior oceanographers dive deep to explore hydrothermal vent communities in the fourth lesson in a series of five. Scholars examine data and look for...
Curated OER
The Greenhouse Effect in a Jar
Students explore climate change by participating in a physical science experiment. In this greenhouse effect lesson, students discuss the impact global warming has on our environment and how it works. Students utilize a glass jar,...
Curated OER
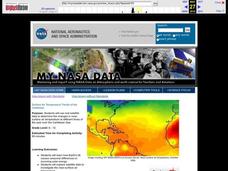
Surface Air Temperature Trends of the Caribbean
Students investigate the seasonal changes to sea surface and near-surface air temperatures near the equator. They use actual satellite data to track and graph the differences in air and sea temperatures during different seasons in the...
Curated OER
The Big Freeze
In this global studies worksheet, students read a 6-paragraph article about climate change. Students respond to 6 short answer questions regarding the article. Vocabulary words from the reading and their definitions are also included.
Curated OER
Gases
Second graders work with gases to determine what the effects of temperature are on volume and air pressure by working with balloons. Also, they experiment with vinegar and baking soda. They predict the outcomes of these experiments, and...
Curated OER
Maintaining Strong Fisheries
Students play a game about the life cycle of a blue crab in order to witness the causes of changes in the crab population and discuss what a resource manager could do to keep a stable crab population. Students then create a game titled...
Curated OER
The Lake Effect
Fourth graders conduct an experiment demonstrating the effects of water and air temperature on precipitation. They create graphs demonstrating their findings using Claris Works for Kids.
Curated OER
I Can See and Feel the Change in the Seasons
Students use their senses to investigate the changes in the seasons. They discuss how the Earth moves around the sun and its tilt. They practice using new vocabulary and examining the different seasons.
Curated OER
Heating/Cooling Curve
In this heating and cooling curve worksheet, high schoolers use a given graph of a substance being heated from a solid to a liquid and then a gas over time. They use the graph to answer eleven questions about the phases of the substance...
Curated OER
Is Global Warming Happening?
Students investigate the probability of global warming and the effects of global warming on the environment. They conduct Internet research and collect data, transfer the data onto an Excel spreadsheet, and create a presentation that...
Curated OER
Gaia: The Wisdom of the Earth
Learners are introduced to Gaia theory of natural homeostasis. They graph Earth's temperatures over time, construct terrariums or monitor the outdoor environment. Related videos titles are suggested, but may be outdated. The objectives...
Curated OER
Solar Heat: Building and Testing a Solar Oven
Building a solar oven is always an enriching and engaging activity when your class is studying forms of energy or alternative and renewable energy sources. This lesson plan refers you to the re-energy.ca home website for specific...
Carnegie Mellon University
Bathtub Model
Using a colorful infographic handout and a guide sheet, hold a class discussion about how a bathtub can serve as a model for the greenhouse effect created by Earth's atmosphere. Participants will understand that as energy or matter is...
Information is Beautiful
How Many Gigatons of Carbon Dioxide...?
Here is an interesting infographic that presents information on the amount of carbon dioxide we can safely release into the atmosphere compared to the actual amount we have released to date.
Curated OER
Paleoclimate of the Hudson Valley
Young scholars recognize how the climate of the Hudson Valley has changed since the last glaciation and be able to explain these changes. They reconstruct the paleoclimate of the Hudson Valley.
Space Awareness
The Big Meltdown
Explore the world (our world) of melting ice caps. Why are these caps melting? What is the effect of melting ice caps? Dive into the ever-present issue of global warming with a resource that has learners looking at data and participating...
Space Awareness
Seasons Around the World
Why does Earth experience summer, fall, winter, and spring? Using an informative demonstration, learners see how the angle of the sun on Earth and the rotation of Earth determine the seasons. Scholars work in pairs to learn that the...
Curated OER
Earth's Warming Climate: Are We Responsible
Learners examine the atmospheric data for CO2. In this web-based atmospheric lesson, student follow instructions to examine and plot on-line scientific data about the CO2 levels in our atmosphere and analyze the changes found in the data.
Curated OER
A Meal of Endurance
Students evaluate the nutritional value of the explorers' meals. This is done through analyzing caloric intake versus caloric expenditure, describing the trend in diet change that explorers experienced over a two year expedition, ...
Curated OER
In the Eye of the Hurricane
In this science worksheet, students read about temperature and thermal energy in a hurricane. Students also draw their own hurricane and label 5 different parts.
National Wildlife Federation
Ghost Town
Around 93 percent of the reefs on Australia's Great Barrier Reef have been bleached, and almost one quarter of them are now dead. Scholars research the sea temperatures, especially around the areas with coral reefs, to make connections...


