Curated OER
Technology as a Tool of Science
High schoolers monitor streams, take stream surveys, collect chemical and macro-invertebrate and stream discharge data. Using a digital camera, students observe the percentage of various types of vegetation on the flood plan, riparian...
Curated OER
Family Life Cycle - Children's Lab
Learners review how their nutritional needs change over time. In groups, they design their own menu in which they get all the nutrients they need. To end the lesson, they share their foods with the class and complete a wordsearch...
Curated OER
Variables Affecting Earth's Albedo
Students study the variables that affect the Earth's albedo. In this environmental data analysis lesson plan students interpret and graph information and calculate changes.
Curated OER
Guetemala's Changing Forest
Eighth graders compare their local ecological zone to the tropical rainforest. In this natural ecology lesson plan, 8th graders complete an activity about the differences in ecological zones. They compare their biome to the Guatemalan...
Curated OER
Global Climate Lesson Plans
Students explore the concept of global climate. For this global climate lesson, students research and investigate global warming and its effects on the world over the course of 9 lessons. Students create a proposal that show the effects...
Curated OER
Dimming The Sun
Students review the meanings of global warming and global dimming. While watching a video, they take notes on different aspects of the issue. In groups, they develop a list on what can be done to reduce global dimming. They...
Curated OER
Understanding the Cosmic Microwave Background (CMB)
How did our universe really begin? Explore the Science Big Bang Theory and Cosmic Microwave Background (CMB) with this multiple activity-based lesson that demonstrates that the increase of density due to the decrease of temperatures,...
Curated OER
Kinetics Worksheet
In this kinetics worksheet, students use concentration-time date tables to determine the rate of reaction and reaction order at each temperature. This worksheet has 4 problems to solve.
California Academy of Science
Rock Cycle Roundabout
After a basic introduction to the rock cycle and the three main types of rocks, young geologists can deepen their understanding of how rocks change through a fun learning game. Based on the characteristics and events shared by a reader,...
Curated OER
Math Investigations Facilitation Plan
In this math lesson plan, students choose a topic involving math that interests them to investigate or research. Students make a plan detailing how they will investigate their topic; such as, keeping track of plant heights over time,...
Santa Monica College
Chemical Equilibrium and Le Chatelier’s Principle
Henri-Louis Le Chatelier wrote many papers throughout his 85-year life, but he is remembered for one of his earliest discoveries, now known as Le Chatelier's Principle. The final activity in an 11-part series encourages young chemists to...
Curated OER
Hurricanes and Climate
Students investigate maps and data to learn about the connections between hurricanes and climate. In this exploratory lesson students describe and graph the 6 regions where hurricanes happen and discuss how hurricanes have changed over...
University of Texas
Lives of Stars
Stars exist from a few million years to over 10 billion years, depending on their mass. Scholars perform a play acting as stars to learn about their different life cycles. They develop an understanding of many of the fundamental concepts...
Curated OER
Global Warming: Life in a Greenhouse
Students investigate the evidence and consequences of global warming. They read and discuss an article, conduct a debate, evaluate their community's climate statistics, log their gas consumption for a week, and develop a panel discussion...
Curated OER
Invasives and Marsh Birds
Students are taught that invasive plant removal can have a variety of impacts. They are shown this by using graphs. Students view maps of vegetation change on Iona Island. They discuss implications of changes on marsh birds using data...
Curated OER
Rain Forests: A Disappearing Act?
Students examine and locate rainforests on maps, and research the patterns of their destruction. They develop a bar graph of rainfall and temperature data, write a journal entry, and research the people, animals, and plants/products of...
Curated OER
Is Our Water Healthy?
Students test water for a least one chemical characteristic. They hypothesize how a storm event might change the chemical characteristics of a stream. Students collect water samples and use the chemical test to test the water.
Curated OER
Plants Help Keep a House Cool!
Pupils experiment with tree shading and house colors to see how to reduce the temperature of a home.
Balanced Assessment
On Averages and Curves
Determine the average on a curve. The class finds graphical representations of averages and expresses them both symbolically and on the graph. The assessment requires class members to justify using average to describe graphs.
Chicago Botanic Garden
Plant Phenology Data Analysis
Beginning in 1851, Thoreau recorded the dates of the first spring blooms in Concord, and this data is helping scientists analyze climate change! The culminating instructional activity in the series of four has pupils graph and analyze...
Curated OER
Conductivity - Pass the Buoy and Pepper, Please
Buoys around our coastlines are equipped with sensory devices which monitor temperature, salinity, and water pressure. Emerging earth scientists examine some of this data and relate salinity to the electrical conductivity of the surface...
Curated OER
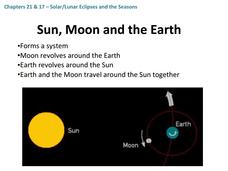
Solar/Lunar Eclipses and the Seasons
How do the moon, sun, and Earth line up to create eclipses? Why do the seasons change throughout a year? The answers to these questions are explained through this series of slides. This apt presentation outlines information using bullet...
Polar Trec
Calorimetry Lab
Young people between the ages of 11–13 need on average about 2,000 calories per day. Within the lab, groups learn about calorimetry and respiration. They explore how it pertains to humans and animals living the Arctic where cold...
Chicago Botanic Garden
Preparing for Project BudBurst
Plants take cues from the environment—change in daylight hours and temperature—to complete their seasonal life cycles. Lesson four in the series of six has classes collect phenology data on plants. After taking initial observations,...


