Curated OER
Water and Ice
Students explore the states of water. In this water states lesson, students observe ice over time and the changes that take place. Students read a related text and draw their observations in a journal entry. Students discuss the...
Curated OER
Carbon Dioxide Heats It Up
Students design an investigation to test whether vegetation in an area helps regulate the ambient air temperature. They make comparisons between the investigation and global changes in climate. In groups, they present their findings to...
North Carolina Museum of Natural Sciences
Weather Watch Activity Guide: Groundhog Day
Exactly what do groundhogs know about weather? Not as much as your science students will after completing these lessons and activities that cover everything from the earth's rotation and the creation of shadows, to cloud...
Balanced Assessment
Pen Pals
It's always nice to hear from friends. Your budding mathematicians read letters from pen pals and convert customary measurements into metric units and vice versa. They also write letters to an imaginary pen pal using metric units.
Curated OER
Range, Mean, Median, and Mode
Eighth graders find the range, median, mean, and mode of a data set. In this finding the range, median, mean, and mode of a data set activity, 8th graders collect data about the high and low temperature for 10 different cities. ...
Curated OER
Shedding Light on the Weather with Relative Humidity
Learners study weather using a graphing calculator in this lesson. They collect data for temperature and relative humidity for every hour over a day from the newspaper, then place the data in their handheld calculator and examine it for...
Curated OER
Diffusion
Students investigate diffusion using different solutions of chemicals placed in agar dishes. In this diffusion lesson plan, students observe 3 demonstrations of diffusion using perfume, food coloring in water and sugar cubes in water....
Curated OER
Observing Weather
Students investigate the weather by reading children stories. In this weather observation lesson, students read Cloudy With a Chance of Meatballs and several other stories about weather before they create a KWL chart. Students utilize...
Curated OER
Climate Mime-it
Students pantomime new climate vocabulary words. In this climate lesson, students go over new vocabulary words and their meanings. Students form groups and pantomime these word's definitions.
Curated OER
Plop! Plop! Fizz! Fizz!
Fourth graders study physical and chemical weathering. They explain how the processes of weathering and erosion change and move materials that become soil. They create a K-W-L chart to show what they know and list what else they would...
Michigan Sea Grant
Water Quality
Learners observe water samples and measure the samples' water quality. Students develop their own criteria for measuring water quality and test for temperature, acidity, oxygen levels, turbidity, conductance, sediment and hardness.
Curated OER
Science: How Tall Are Plants
First graders investigate plant growth and examine what factors contribute to plant growth. They keep a class chart of plant growth and write about and illustrate their conclusions.
Curated OER
Weather
Students track wind speed and direction, barometric pressure, air temperature, and precipitation for a month using a newspaper. They chart the data over a months time.
Weather Bug
WeatherBug
Exploring the weather has never been more intriguing! Whether you are looking for a quick glance at the 10-day forecast, trying to figure out if lightning is heading your way, or wondering what the pollen count is, you will find out...
Polk County Education
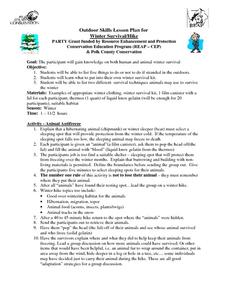
Winter Survival/Hike
Hibernation isn't just about staying fed, it's about staying warm. Young environmentalists explore the importance of staying warm in the wilderness with a short lesson about surviving in the wild. Using gelatin to represent warm-blooded...
Curated OER
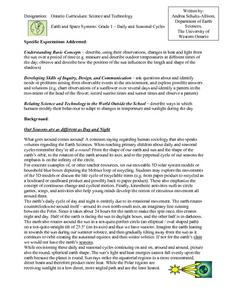
Science: Daily and Seasonal Cycles
First graders use their observations to describe daily and seasonal cycles. through a demonstration using a suspended ball and flashlight, they determine the time of day in various locations. Next, 1st graders participate in a...
Curated OER
Blooming Thermometers
Students study phenology, or the study of climate change. They research the Japanese springtime festival of Hanami and plot and interpret average cherry blossom bloom date data from the past 1100 years.
Curated OER
Student Exploration: Pond Ecosystem
In this student exploration-pond ecosystem worksheet, students use the Pond Ecosystem Gizmo to measure oxygen concentrations and temperature and record the data on charts.
Curated OER
Arctic Microclimates
Learners identify, measure, and average micro-climatic temperatures in a particular region. They draw a small-scale map of an area to be sampled (classroom, playground, park, backyard) and identify potential locations for...
Curated OER
Is Global Warming Affecting Hurricanes?
In this hurricane worksheet, students use data charts showing the number of hurricanes and the severity of these hurricanes to determine if global warming is causing an increase in hurricanes. This worksheet has 2 short answer questions.
Curated OER
Meet the Weather Scientist
Fourth graders collect, record and analyze data using simple weather instruments or use weather resources to comprehend weather. They comprehend that scientists are very important people in today's world. Pupils look at cloud types to...
Curated OER
Air Pressure & Barometers
Fourth graders observe, measure, and record data on the basic elements of weather over a period of time (i.e., precipitation, air temperature, wind speed and direction, and air pressure). Then, they make a barometer and keep record of...
Curated OER
Changes Close To Home
Students interview the senior citizens in their community. While interviewing them, they identify perceptions they have about the local climate. Using the internet, the compare the results of the interview to those of public thirty...
Curated OER
Weather v. Climate
Ninth graders discuss the differences between climate and weather as a class. Using data they collected, they create a graph of the data to share with the class over a specific time period. They compare and contrast this data with...


