Texas Instraments
Getting Started Dilemma
Get out those thinking caps and apply graphing functions to a real-world problem. Use the TI-83 graphing calculator to evaluate algebraic expressions that are imbedded in a series of real-world scenarios. A great lesson!
Curated OER
Scatter Diagrams and Curve Fitting
In this Scatter Diagrams and Curve Fitting worksheet, students are guided in how to graph a scatter diagram (plot) and a Best Fit Line using a TI-83 graphing calculator.
Curated OER
TI Calculator
In this algebra worksheet, 11th graders troubleshoot the TI-83/84 graphing calculator. They review the proper process to use when entering equations and fractions into the calculator. There are 4 example problems worked out.
Curated OER
Cryptography on the TI-83 Graphing Calculator
Learners explore the history of cryptography. They assess function notation and transformation, matrix operations, and the fundamentals of modular arithmetic. Using graphing calculators, students develop their own encryption schemes.
Curated OER
Using the Ti-83 Graphing Calculator
In this graphing calculator worksheet, students complete 11 operations on the calculator. Students enter absolute value, exponents, radicals, fractions, mixed numbers, etc.
Curated OER
Get Your Numbers in Shape - TI-83
High Schoolers use the TI-83 calculator to produce a sequence, explore patterns and find a linear or quadratic equation for a given pattern. They use inductive reasoning to make conjectures about patterns. They find the Y-value of a...
Curated OER
Box Plots on the TI-83 Calculator
Eighth graders research box plots on the Internet. They gather real life statistics and analyze the collected statistics by making multiple box plots on the TI-83 calculator.
Curated OER
Dependence of Light Intensity on Distance
Hopefully you have a sensor interface for your physics class to use with graphing calculators when collecting data with a light sensor. If so, read on. Use this resource for learners to predict and then test whether or not the intensity...
Texas Instruments
Drawing a Line Tangent to a Circle
Explore lines tangent to a circle. In this math lesson, students manipulate circles and lines on a TI calculator. They draw a circle and analyze perpendicular lines intersecting the circle in only one place. This activity works...
Curated OER
Exploring Quadratic Data with Transformation Graphing
Using a data collection device to collect data regarding a bouncing ball, students use various features on graphing calculators to experiment with the parameters of the vertex form of the parabola and their effect on the shape of the...
Curated OER
Making Connections: Matrices, Graph, Linear Systems
In this set of activities, matrices and equations are explored. They work with matrices using pen and paper as well as graphing calculator. Additionally real-world problems are explored.
Curated OER
Systems of Equations
Texas Instruments and Glencoe/McGraw-Hill have put together a full instructional activity to help you instruct your math class. Using the textbook, a TI-83 calculator, and attached the PDF learners will solve systems of equations and...
Curated OER
Time That Period
Physical science starters play with a pendulum in order to experience periodicity. Detailed procedures and a worksheet are included for day one. For day two, learners will use a graphing calculator to help them plot orbit data from a...
Texas Instruments
Graphing Calculator Investigation Graphs of Relations
Learners investigate relations in this algebra lesson. They graph the set of ordered pairs that determine a relation. Using a TI-83 Plus, your learners will enter the coordinates in a list, create a scatter plot, and manipulate the...
Curated OER
Exploring Quadratic Data : Transformation Graphing
High schoolers analyze the vertex form of a parabola and find an approximate fit of a model. They explain the quadratic parabola function and its properties by developing quadratic models. They use translation and dilation to change the...
Curated OER
What's My Pattern?
Students recognize, describe and extend patterns in three activities. They organize data, find patterns and describe the rule for the pattern as well as use the graphing calculator to graph the data to make and test predictions. In the...
Texas Instruments
Finding Linear Models Part III
Explore linear functions! In this Algebra I lesson, mathematicians graph data in a scatter plot and use a graphing calculator to find a linear regression and/or a median-median line. They use the model to make predictions.
Curated OER
Graphing Quadratic Functions
Pupils explore quadratic functions in this algebra lesson. They investigate transformation of quadratic functions using the TI calculator. They use the vertex form for this lesson.
Curated OER
Investigating Linear Equations Using Graphing Calculator
Students investigate linear equations using the Ti-Calculator. In this algebra lesson, students graph lines and identify the different quadrants on a coordinate plane. They identify ordered pairs used to plot lines.
Curated OER
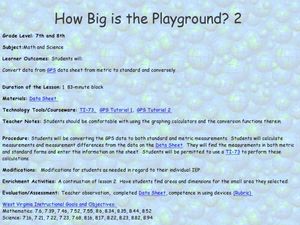
How Big Is The Playground?
Students calculate the standard and metric measurements of a playground. In this measurement instructional activity, students use GPS coordinates and graphing calculators to determine the dimensions of an area outside of the school in...
Curated OER
Move My Way: A CBR Analysis of Rates of Change
Learners match a given velocity graph and sketch the corresponding position graph using a graphing calculator. After collecting data from their everyday life, high schoolers use specific functions on their calculators to create graphs...
Curated OER
Ashes to Ashes: Using Evaporation Rate to Identify an Unknown Liquid
Learners explore the concept of evaporation rates in this evaporation rates lesson. They will try to identify the chemical that began a fire, perform an experiment where they use the evaporation rates to determine the unknown liquid, and...
Curated OER
TI-83 Tutorial for statistics
Students learn the uses of the TI-83 calculator for statistical operations.
Curated OER
Introduction to Limits
High schoolers practice using graphing calculators and spreadsheets as they explore numeric limits using sequences and functions. They complete a sequencing worksheet, and determine which sequence corresponds to story a story called...


