Curated OER
What is my Angle? App
Learners estimate angle measures in this this estimating angle measures lesson. They use an application on their graphing calculator that shows various settings involving angles and then they estimate the angle measure of a clock's...
Curated OER
Name That Tune: Matching Musical Tones Through Waveform Analysis
Pupils detect the waveform of musical notes to determine the code for the "safe" in this forensics simulation lesson. They use a microphone and tuning forks along with Vernier EasyData on their graphing calculator to analyze five musical...
Curated OER
One of the Many Ways
Explore the concept of polynomials and determine the value and number of zeros for a given polynomial using the Rational Root Theorem. Then graph the polynomials and relate the number of zeroes to the degree of the polynomial.
Curated OER
Means of Growth
Pupils collect and graph data. In this statistics lesson, students analyze their plotted data using a scatter plot. They identify lines as having positive, negative or no correlation.
Curated OER
The Closer I Get To You
Pupils explore the law of reflection. Through experimentation and problem solving, they collect and analyze data pertaining to reflection. The data is plotted on a graph and formulas for calculating the x and y values are evaluated.
Curated OER
Finding Patterns and Graphing Functions
Pupils investigate patters for area and perimeter. In this Algebra I/Geometry lesson, students explore two different patterns as they write a formula for the nth term of each pattern. Pupils graph their results and determine if the...
Texas Instruments
Making Predictions Using Systems of Equations
Students explore the concept of systems of equations. In this system of equations instructional activity, students enter data into lists on their calculators about 100 meter dash times. Students plot the points using a scatter plot and...
Curated OER
Guess the Ages
Learners explore scatter plots in this algebra lesson. They create a scatter plot from their guesses regarding a famous person’s birth date and the actual birth date then they examine and interpret the results of their graph.
Curated OER
Corn-Crop is a Bin-Buster
Learners calculate percent change and create lists of data. They enter the corresponding bushels of corn measured in billions to their list and display, then convert the acres into scientific notation and use the value on the home screen...
Curated OER
Fishing for Points TI-83/83 Plus
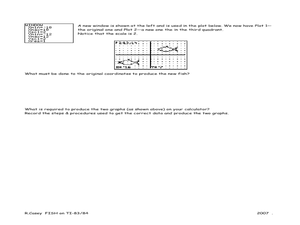
Ninth graders investigate the Cartesian coordinate plane. In this Algebra I instructional activity, 9th graders explore the coordinates of a drawing of a fish and examine the effects of moving the drawing on the ordered pairs....
Curated OER
The King's Chessboard
Middle schoolers speculate on the better rate of pay: a dollar a day for 10 days, or a penny the first day, two pennies the second, doubling each day for 10 days. Start by listening to the story The King's Chessboard, by David Birch....
Curated OER
Going Back to Your Roots
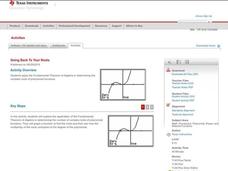
Who doesn't need to know the Fundamental Theorem of Algebra? Use the theorem to find the roots of a polynomial on a TI calculator. The class explores polynomials with one solution, no real solutions, and two solutions. This less lesson...
Curated OER
Visualizing Vectors
Investigate vectors in standard positions and use the CellSheet application on the TI calculator to find the sum of two vectors. Convert from polar to rectangular coordinates and vice versa, and show graphs of the vectors.
College at Brockport
Healthy Ecosystems
Is there a connection between the snowshoe hare population and the lynx population? Young scientists will examine this question and graph actual data to determine the relationship between these two species, as well as researching another...
Curated OER
Betweenness and the Sum of Parts
High schoolers differentiate lines and angles using betweenness in this geometry instructional activity. They differentiate angles and lines using Cabri Jr. and analyze the data and make conjecture.
University of Georgia
Endothermic and Exothermic Reactions
Equip your chemistry class with the tools to properly understand endothermic and exothermic reactions. Young chemists collect, analyze, and graph data to determine how the Law of Conservation of Matter is applied to chemical...
Curated OER
Geometry: Translations and Reflections
Group work and participation is used to perform a specified translation or reflection. In this geometrical translation lesson, small groups of pupils are each given a shape to plot on a coordinate grid. Each shape is then translated or...
Curated OER
"You're Hired!'
Students investigate linear programming using the TI. For this algebra lesson, students collaborate and graph linear inequalities on a TI. They analyze their data and present it to the class.
Texas Instruments
Say What You Mean!
Students analyze data and identify the mean. In this probability lesson, students log data in the TI and construct scatter plots from the data. They identify properties of a scatterplot.
Curated OER
Standard Form of Equations
Learners complete the square and identify different parts of a quadratic equation. In this algebra lesson, pupils graph conics using the TI calculator. They rewrite equations by completing the square.
Curated OER
Slow Down - Speed Up
Pupils explore the concept of distance and time as they use a CBR to mimic distance v. time graphs. Learners walk towards and away from the monitor to create various distance v. time graphs, then discuss what motion creates certain graphs.
Curated OER
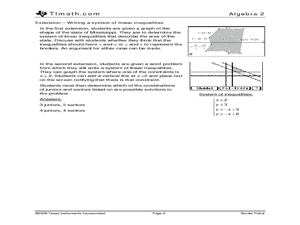
Border Patrol
Young scholars investigate systems of linear inequalities as they apply to an area of land. They practice graphing systems and determine if a point lies in the solution.
Curated OER
Midpoint of a Segment
Learners revisit midpoint and segments by graphing on the TI or computer. This activity can be done with pencil and paper, but is more interactive if it is done on a TI-navigator.
Curated OER
Wrapping It All Up
Through learning how to examine linear, quadratic, and exponential functions, young scholars explore the effects of changes in parameters on the graphs of linear, quadratic, and exponential functions. The lesson plan is designed to...


