Curated OER
Writing Lesson Plan: Homework Books
What a way to end the day! Class members recall important events that occurred throughout day. These events are posted on the chart board for class members to copy into their Homework Book. Books are sent home for parents to read, sign,...
PBS
Latino Americans: Timeline of Important Dates
From 1500-2000, an interactive timeline details important events related to Latino Americans. Next, to each date are small, yet informative blurbs—some of which include videos.
Curated OER
The Journey to Civil Rights
Students explore Civil Rights. In this Civil Rights lesson, students read about Ruby Bridges and define the words segregation and supremacy. Students make a timeline of important events in Civil Rights and write a paragraph about why the...
Curated OER
Dia de la Raza - What is El Dia de la Raza?
Students research and write about Christopher Columbus, his voyages, and his impact on the Native Americans. In this Christopher Columbus lesson plan, students work at stations where they learn vocabulary, perform Reader's Theatre, work...
Curated OER
Standard Measurements
In this math instructional activity, students convert standard measurements. Students give the equivalent of the standard measurements. Hints are given if needed.
Curated OER
The Grouchy Ladybug
Students complete a Cirlce Map about time. They recall times during the grouchy ladybugs travels, and add dots on ladybugs using turn-around facts. Pupils correctly sequence the events of The Grouchy Ladybug. Students compose new...
Curated OER
Mars Calendar Project
Learners design a calendar that displays time on Mars. They explore the differences between time on Earth and time on Mars while making the calendar.
TCI
Dreams Progress
Has society progressed to the dream Martin Luther King Jr. expressed in his famous address during the civil rights movement? Learners work with a partner to analyze one excerpt from King's "I Have A Dream" speech and find a current image...
Illustrative Mathematics
Weather Graph Data
Teaching young mathematicians about collecting and analyzing data allows for a variety of fun and engaging activities. Here, children observe the weather every day for a month, recording their observations in the form of a bar graph....
Howard County Schools
To Babysit or Not to Babysit?
Would you work for a penny today? Use this activity to highlight the pattern of increase in an exponential function. Scholars compare two options of being paid: one linear and one exponential. Depending on the number of days worked, they...
Curated OER
Energy Through the Ages
In this energy through the ages worksheet, students read about the history of energy use beginning with early civilization and the use of water wheels for the production of energy to hydrocarbon-based coal, oil and natural gas of today....
Curated OER
Piles of Paper
Track how much paper their class uses in a week. They will pile their used paper into one place, each day the pile is measured. They make predictions about how much paper they would collect in a month, then recycle the paper.
Curated OER
Decimal Problems
In this decimals instructional activity, students solve 18 different types of problems that include both decimals and non-decimals. First, they subtract the measurement problems given both in metric units and in US units. Then, students...
Perkins School for the Blind
Daily Journal
Keeping a daily journal is fun. It builds strong writing skills and provides an expressive outlet. For children with visual impairments, it's even more important. It provides a way for them to connect written word with real events, which...
Curated OER
Get Acquainted with the Great Outdoors
National Parks and Recreation Month offers opportunities to improve health and education.
Curated OER
Choral Counting I
Using a 100s chart or a number line with a pointer, work with your class to count up to 100 by ones and tens. As a part of daily instruction, prompt your kindergartners to chant count from 1 to 30. Move on to 1 to 50, and then from 1 to...
School World
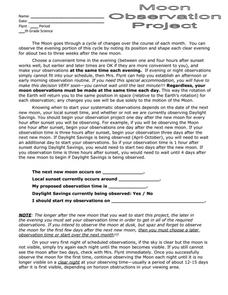
Moon Observation Project
Mrs. Flynt has designed a 12-day moon observation activity that is best assigned when daylight hours are shorter. Middle school moon experts record several factors, including the altitude above the horizon, the azimuth, the phase, and...
Curated OER
Eating Up Idioms
Ah, food idioms! Now that sounds tasty. Class members read and discuss various food-related idioms, create an illustration of a food-related idiom, and develop a class book or bulletin board to celebrate figurative language and National...
Concord Consortium
Here Comes the Sun
Many phenomena in life are periodic in nature. A task-based lesson asks scholars to explore one of these phenomena. They collect data showing the sunrise time of a specific location over the period of a year. Using the data, they create...
Steered Straight
Marijuana Awareness
February is Marijuana Awareness Month, and a set of interdisciplinary activities can make your class aware of the social, medical, legal, and psychological effects of marijuana. With writing prompts, research opportunities, and...
Curated OER
Exploring Seasonal Shadows and Sunlight
What can shadows tell us about the changing season? Over several months, astronomy learners record length and position of an outdoor object's shadow, such as a flagpole. They apply the data to a growing hypothesis and note the patterns...
Curated OER
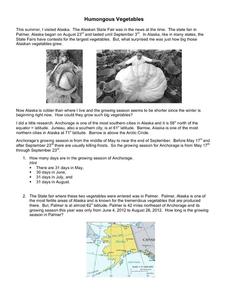
Humongous Vegetables
Humongous vegetables can inspire and awaken your mathematicians to the large math concepts in our Common Core standards. What is the secret to growing such gargantuan garden objects in Alaska? In the state that is closest to the North...
Curated OER
Morning Fitness Tips
Share Morning Fitness Tips with your class, or your whole school! You will have to put time and effort into preparing your costumes and in getting together what fitness information, you want to share, but the program is a great addition...
Curated OER
What Goes Up Must Come Down!!
Fifth graders look at actual sunrise and sunset times for their hometown to determine a pattern in the amount of daylight. They collect their data in Excel and create a chart to help them identify the pattern, then write an explanation...


