Curated OER
Discovering Pi
Fourth graders are introduced and experiment with the concept of pi. Using this information, they discover the relationship between the circumference and diameter of circles. In groups, they practice measuring the circumference of...
Curated OER
Statistics: Final Exam Review
In this statistics and probability worksheet, learners are provided with a review of the final exam in statistics. The three page worksheet contains a combination of six multiple choice and free response questions. Answers...
Curated OER
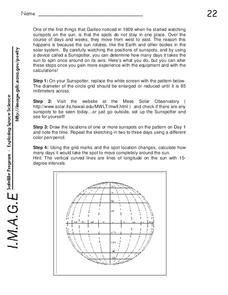
Sunspots and the Sun's Rotation
For this sun worksheet, students use a Sunspotter to observe the rotation of the sun by identifying the presence of sunspots and watching them rotate over time. Students calculate how many days it takes to see the sunspots they observe...
Curated OER
Graphic Designing with Transformed Functions
Teach your class how to transform a graph! By identifying the domain and range of the functions, students can observe the parabola and find the vertex of the transformed graph.
Curated OER
Looking for More Clues
Fifth graders explore how to collect data and display it on a bar and circle graph.
Curated OER
Graph Logarithms
Mathematicians graph logarithmic equations. Teach your students how to identify the intercepts of logarithmic equations and tell whether the function is increasing or decreasing. They find the domain and range of each function.
Curated OER
Domain and Range 2
How do you identify the domain and range of the function? As learners find out it's as easy as creating a graph. They'll identify the domain and range of a relation from its graph, write symbolic expressions describing the relationship...
Curated OER
Exponential vs. Power
Pupils differentiate between exponential and power functions. They identify the base, exponent and properties of exponential functions. They also graph the functions using the TI calculator.
Curated OER
Fast Food Survey Using Bar Graphs
Second graders create a bar graph to pictorically represent the data collected from a survey of students. They use Excel to electronically create the graphs and data tallies. They then interpret their data using sentences to explain.
Curated OER
What's Your Angle?
Third graders read the story, Magic Schoolbus Inside the Human Body. Then they form right, acute, and obtuse angles using the joints inside their bodies. They write a brief summary about what they learned about angles as a review the...
Curated OER
Introduction to Field Mapping with a Compass and Pace
Students practice using compass and calibrate their own pace, take field measurements of pre-set course with compass and pace, convert measurements into map, using angles and vectors, and make composite class map by adjusting different...
Curated OER
MAPS AND TOPOGRAPHY
Students analyze the details of a topographic map and create one of their own by utilyzing a map of elevations.
Curated OER
More Bait for Your Buck!
Learners determine where to buy the heaviest earthworms as they study invertebrates. They create a double bar graph of the results of the weight data.
Curated OER
Get to Know Snow!
Students learn about snow. In this snow themed lesson, students read a book, make a painting, and observe snow. A math activity timing how long it takes for snow to melt is included.
Curated OER
The Little Ice Age - Understanding Climate and Climate Change
Fourth graders receive data about tree ring records, solar activity, and volcanic eruptions during the Little Ice Age (1350-1850). From this data, they draw conclusions about possible natural causes of climate change
Curated OER
Measure Me!
Third graders use nonstandard concrete methods to estimate and record measurements of their body.
Curated OER
Cuisenaire Chefs
Students study the fractional values of Cuisenaire rods while working with favorite family recipes.
Curated OER
Thirsty for A Liter or Milliliter?
Second graders work with liters and milliliters for measurement.
Curated OER
Simple Bar Graphs Using Excel
Students create original survey questions, and develop a bar graph of the data on paper. They input the survey data using two variables onto an Excel bar graph spreadsheet.
Curated OER
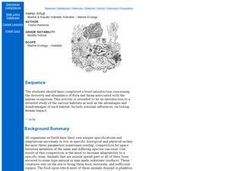
Marine & Aquatic Habitats Activities - Marine Ecology
Students enact the life cycle of a sessile animal and quantify the possibility of survival under the conditions given. They then present to the class a new adaptation which will increase the animals chance of survival.
Curated OER
Measuring a Mummy Case
Students calculate the size of a mummy case and its contents using ancient Egyptian measurements.
Curated OER
Geo Jammin' - Day 5, Lesson 16: Capturing "Lions" of Poetry
Second graders participate in the Author's Chair, which is placed in the front of the room. The puppet, Geo George, asks students to take out their poems, then brings them to the Author's Chair individually to share their poems with the...
Curated OER
Shadow Trackers: From Photography to Writing
Students explore the rotation of the earth. In this science lesson, students view photos of various places around the world. Students conduct an experiment in which they can see how the earth's rotation creates shadows on the earth.
Curated OER
Athletic Reader
Pupils research the history of the sport they are participating in. They conduct research and write a report, create a timeline of the sport, and investigate the history of the sport in other countries. Students then observe and...


