EngageNY
Margin of Error When Estimating a Population Mean (part 1)
We know that sample data varies — it's time to quantify that variability! After calculating a sample mean, pupils calculate the margin of error. They repeat the process with a greater number of sample means and compare the results.
Howard County Schools
Constant Rate Exploration
Question: What do rectangles and bathtub volume have in common? Answer: Linear equations. Learn how to identify situations that have constant rates by examining two different situations, one proportional and one not proportional.
Curated OER
Coloring Interval Graphs
Students investigate planning an activity and getting it done on time. In this algebra lesson, students define vocabulary words related quadratic equations, including the vertex and intervals. They figure a good way to color graphs...
Curated OER
Wave Math
Students identify the different factors affecting the size and shape of ocean waves. For this math lesson, students calculate wave speed and wavelength given a mathematical formula.
Curated OER
Function Problems
For this function worksheet, students use given functions to determine the rate at which people enter and exit an amusement park. They compute the number of dollars collected at a specified time and predict when the number of people in...
Curated OER
Dead Body Math
Students solve the mystery of dead Mr. Potato Head using physics and algebra. They discuss Newton's Law of cooling as it applies to the mystery scenario involving a cooling baked potato as the "victim". They manipulate algebraic...
Curated OER
What Time Is It?
Fourth graders distinguish between analog and digital clocks and read time from both types. In this clock reading lesson, 4th graders discuss the types of clocks and the time zones. Students find times in specific time zones. Students...
Curated OER
Telling Time
Students tell time. In this ELL vocabulary development and math lesson, students orally tell time to five minute intervals when shown a classroom clock. Students practice using number and "telling time" vocabulary in sentences and...
Curated OER
Return Intervals & Reasoning from Tabular Data
Learners calculate derivatives from a set of data. For this calculus lesson, students estimate the limit at infinity. They complete a Return Interval handout at the end of the lesson.
Curated OER
Television Schedule Time
Young scholars consider the concept of elapsed time by examining television schedules. They list five television shows and highlight them in a newspaper, marking down the beginning and ending time of each show. They use clocks to figure...
Curated OER
Elapsed Time Two
Students study how to calculate elapsed time. In this elapsed time lesson, they determine how to calculate the ending time of an event when they are given the starting time and the elapsed time. They participate in direct instruction,...
Curated OER
Tiling Tessellations
Students explore tessellations. In this shapes and geometry lesson, students describe the attributes of many of the shapes displayed on an Elmo. Students create examples of tessellations using pattern blocks.
Curated OER
Worksheet 28: Parametric Equations
In this parametric equations worksheet, young scholars read informational paragraphs and answer 10 questions regarding parameter, velocity, speed, curvature, parametric equations, and scalar curvature.
Curated OER
Worksheet 2: Graphs, Functions and Derivatives
In this math worksheet, students answer 7 questions having to do with graphing derivatives of functions, rectilinear motion, speed and distance.
EngageNY
Square Roots
Investigate the relationship between irrational roots and a number line with a resource that asks learners to put together a number line using radical intervals rather than integers. A great progression, they build on their understanding...
Curated OER
Worksheet 14: Properties of Logs
In this math worksheet, students are given 7 problems in which they review properties of logs and solve, differentiate formulae, find derivatives and solve story problems involving the rate of spread of a disease and Newton's Law of...
Virginia Department of Education
How Many Triangles?
Something for young mathematicians to remember: the sum of any two sides must be greater than the third. Class members investigates the Triangle Inequality Theorem to find the relationship between the sides of a triangle. At the...
Federal Reserve Bank
The Pickle Patch Bathtub
What do your pupils want to save up their money for? Based around the book The Pickle Patch Bathtub, this instructional activity covers opportunity cost, saving, and spending. Learners participate in a discussion and practice making...
Curated OER
US Population 1982-1988
Your algebra learners make predictions using the concepts of a linear model from real-life data given in table form. Learners analyze and discuss solutions without having to write a linear equation.
Curated OER
Drive the Data Derby
Three days of race car design and driving through the classroom while guessing probability could be a third graders dream. Learn to record car speed, distances traveled, and statistics by using calculation ranges using the mean, median,...
EngageNY
Graphs of Exponential Functions
What does an exponential pattern look like in real life? After viewing a video of the population growth of bacteria, learners use the real-life scenario to collect data and graph the result. Their conclusion should be a new type of...
Curated OER
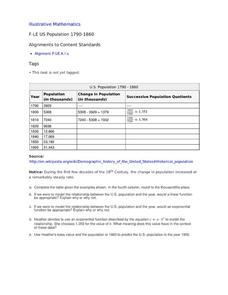
US Population 1790-1860
Your young population scientists analyze a table of values, write a model to represent the real life data, finish the table of data and predict future populations in a collaborative, real-life activity.
Curated OER
Model Air Plane Acrobatics
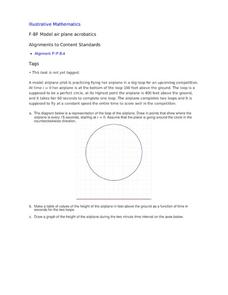
Your young airplane enthusiasts will enjoy this collaborative task of graphing an airplane's distance from the ground as it flies in a perfect circle. They will discover that they have graphed a sinusoidal function that comes from the...
Curated OER
What Time Does the Last Worker Report?
Third graders explore the concepts of time and consumer goods. In this telling time activity, 3rd graders respond to questions about the passage of time and goods and services. This activity incorporates the use a video titled...


