College Board
Frozen in Time
Take a closer look at increasing and decreasing behavior by zooming in on graphs. An AP® Calculus reference document examines how increasing/decreasing behavior should be considered in terms of intervals rather than points. The resource...
Curated OER
Analog Clock Faces: Drawing Hands on Analog Clocks Telling Digital Time in 5 Minute Intervals
In this telling time learning exercise, students study 9 blank clocks with a digital time written below. Students draw the hands on the clocks to match the times that are to the nearest 5 minutes.
Mathematics Assessment Project
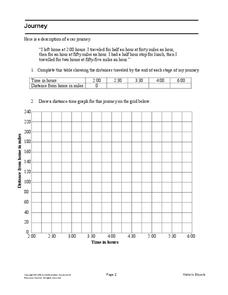
Journey
Drive home math concepts with an engaging task. Learners follow a verbal description to fill in a table and create a distance-time graph representing a car journey. They then answer questions by interpreting the graph.
Curated OER
Acceleration Lab
Young Einsteins experiment with the acceleration of Hot Wheels™ toy cars down inclined planes at various angles. This classic physics lab activity is thoroughly explained in both a teacher’s guide and a student lab sheet. Science...
Lane Community College
Review Sheets: College Algebra
A jam-packed worksheet has all the topics you would teach in an Algebra II class with a variety of question styles. Starting with function notation and ending with geometric sequences, there really is something for everyone. Each...
5280 Math
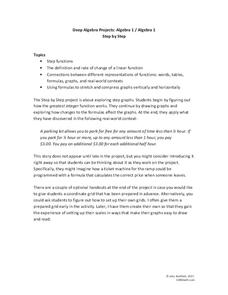
Step by Step
One step at a time! A seemingly linear relationship becomes an entirely new type of function. Young scholars build their understanding of step functions by completing a three-stage activity that incorporates multiple representations of...
Flipped Math
Calculus AB/BC Unit 5 Review: Analytical Applications of Differentiation
Time to put it all together in one sheet—well five. Pupils review all the topics presented in the resources for Analytical Applications of Differentiation. The five pages summarize the concepts with explanations and examples.
Curated OER
Telling Time: Two Ways to Read the Time
Second graders discuss the two different ways of reading time. They study the vocabulary "minutes to" and tell time in five minute intervals. They discuss why it is important to have schedules and students list some schedules that they...
Curated OER
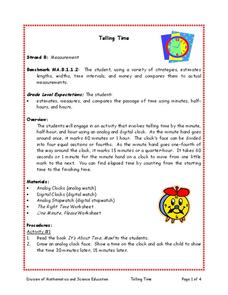
Telling Time
Young scholars estimate, measure, and compare the passage of time using minutes, half hours, and hours. They read the book 'It's About Time, Max!' with the teacher and draw an analog clock face. They show the time and 30 minutes later,...
Curated OER
How Much Will Movies Cost In The Future?
Students use data collection and analysis, statistics, and probability in problem-solving situations and communicate the reasoning used in solving these problems.
Curated OER
Time to Five Minutes: Homework
In this five minute interval counting worksheet, students describe each time as minutes after an hour and minutes before an hour. Students use the analog clocks to answer and finish with one word problem for telling time.
Curated OER
Time to Five Minutes: Problem Solving
In this telling time worksheet, students write the letter of the clock with the time that matches and answers the questions. Students complete four problems.
EngageNY
Increasing and Decreasing Functions 2
Explore linear and nonlinear models to help your class build their function skills. In a continuation of the previous lesson, learners continue to analyze and sketch functions that model real-world situations. They progress from linear...
Council for Economic Education
Calculating Simple Interest
How much is owed? A calculated resource introduces the simple interest formula with a video that describes how to use it. Classmates then show what they know by answering questions within a simple interest worksheet.
EngageNY
Constant Rate
Two-variable equations can express a constant rate situation. The lesson presents several constant rate problems. Pupils use the stated constant rate to create a linear equation, find values in a table, and graph the points. The resource...
Charleston School District
Constructing Scatter Plots
Having more letters in your name helps you get a better grade in your math class—or does it? Learners create scatter plots to organize data. The lesson places emphasis on determining scale and intervals and labeling axis.
Curated OER
Keep Track of time by watching the clock
Students answer questions about the clock. In this time lesson, students answer questions using intervals of five minutes. Students solve problems about how long to the next activity, how much longer, and whether or not we have...
Curated OER
Telling Time
In these math worksheets, students master telling time on clocks using the minute hand and the hour hand. Students write the time shown as well as fill in the hands on the clock for the time that is provided below each clock.
Mt. San Antonio Collage
Test 1: Functions and Their Graphs
Save the time creating an assessment because these function problems should do the trick. With 10 multi-part questions, they each focus on a different topic including radical, polynomial, linear and piecewise functions. The majority of...
Curated OER
Figuring Elapsed Time
Students discover the concept of elapsed time. In this calculating time lesson, students utilize the Internet to complete record sheets based on the concept of elapsed time. Finally, the students answer questions on their own.
Curated OER
What Time is It? Telling Time To Five Minutes
In this math instructional activity, students analyze the time on 10 analog clocks and tell what time it is to five minutes. The hour and minute hands are different colors to help students, and there is also a clock marked with 5 minute...
Curated OER
The Effect of Math Anxiety on Cardiovascular Homeostasis
Using a pulse monitor, learners will measure a resting pulse, take a math test, and then measure the pulse again. They analyze the change in pulse and compare it to performance on the test. This multi-purpose lesson can be used in a...
Charleston School District
Increasing, Decreasing, Max, and Min
Roller coaster cars traveling along a graph create quite a story! The lesson analyzes both linear and non-linear graphs. Learners determine the intervals that a graph is increasing and/or decreasing and to locate maximum and/or...
EngageNY
Graphs of Simple Nonlinear Functions
Time to move on to nonlinear functions. Scholars create input/output tables and use these to graph simple nonlinear functions. They calculate rates of change to distinguish between linear and nonlinear functions.


