EngageNY
Decimal Expansions of Fractions, Part 2
Develop your pupils' understanding of fractions and their decimal equivalence using the 12th lesson in this series. Scholars learn an alternative to long division that results in converting fractions to decimals that emphasize fractional...
Curated OER
Every Five Minutes Word Jumble
In this word scramble worksheet, students read the numbers in five minute intervals in the word bank, unscramble those words on the worksheet, and write them correctly. Students write 12 answers.
Mathed Up!
Frequency Polygons
Frequency polygons are a different way to represent frequencies over intervals. Pupils take frequencies for intervals of data from a frequency table and plot them as a frequency polygon. Budding mathematicians find information about the...
Curated OER
Plan Ahead
In this planning ahead worksheet, 3rd graders utilize a table to track Mrs. Chen's times and errands for the given day. Students word backwards to find out what time Mrs. Chen must leave the mall to complete eight errands.
EngageNY
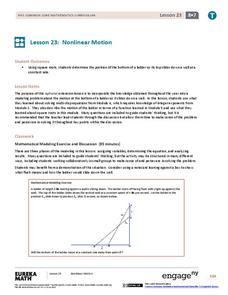
Nonlinear Motion
Investigate nonlinear motion through an analysis using the Pythagorean Theorem. Pupils combine their algebraic and geometric skills in the 24th lesson of this 25-part module. Using the Pythagorean Theorem, scholars collect data on the...
Curated OER
Measurement and Estimation
Students gain an understanding of time. In this time lesson, students work together to recognize the difference between yesterday, today, and tomorrow, As well as months, hours, minutes, and seconds. Students brainstorm ideas of ways the...
Curated OER
Figuring Elapsed Time
Learners tell time. For this elapsed time lesson, students review how to tell time to five minutes. Learners solve problems where they must determine the elapsed time.
EngageNY
Graphs of Piecewise Linear Functions
Everybody loves video day! Grab your class's attention with this well-designed and engaging resource about graphing. The video introduces a scenario that will be graphed with a piecewise function, then makes a connection to domain...
EngageNY
Margin of Error When Estimating a Population Mean (part 1)
We know that sample data varies — it's time to quantify that variability! After calculating a sample mean, pupils calculate the margin of error. They repeat the process with a greater number of sample means and compare the results.
Portland
State
University
Historical Reflections on the Fundamental Theorem Of (Integral) Calculus
Highlight the process of mathematical discovery for your classes. This lesson examines the development of the Fundamental Theorem of Calculus over time. Understanding the history of the theorem helps create a better understanding of the...
CK-12 Foundation
Data Summary and Presentation: Chart for Grouping Data
Get social! Create a display of social media use for a class. Pupils use provided information about the time spent on social media to construct a histogram. Using the histogram, learners interpret the data to answer questions.
Howard County Schools
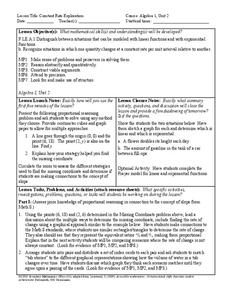
Constant Rate Exploration
Question: What do rectangles and bathtub volume have in common? Answer: Linear equations. Learn how to identify situations that have constant rates by examining two different situations, one proportional and one not proportional.
Curated OER
Coloring Interval Graphs
Students investigate planning an activity and getting it done on time. In this algebra lesson, students define vocabulary words related quadratic equations, including the vertex and intervals. They figure a good way to color graphs...
Curated OER
Wave Math
Students identify the different factors affecting the size and shape of ocean waves. For this math lesson, students calculate wave speed and wavelength given a mathematical formula.
Curated OER
Function Problems
For this function worksheet, students use given functions to determine the rate at which people enter and exit an amusement park. They compute the number of dollars collected at a specified time and predict when the number of people in...
Curated OER
Telling Time Worksheet: Draw Hands on the Clock
For this telling time worksheet, students look at the time underneath 9 clocks and then draw the hour and minute hands on each clock to tell the correct time. Students practice reading clocks in 15-minute intervals.
Curated OER
Draw Hands on the Clock: 30 Minute Intervals
For this telling time worksheet, students solve 9 problems in which the hour and minute hands are drawn to show the correct specified time to the nearest half hour.
Curated OER
Time to Five Minute Intervals
In this time worksheet, 3rd graders practice writing time to the five minute interval using analog clock faces. They write the time on the line under each of 9 clock faces.
Curated OER
Telling Time Worksheet: What Time Is It?
For this telling time worksheet, students look at each clock and write the correct time on the line below it. There are 9 clocks on this page.
Curated OER
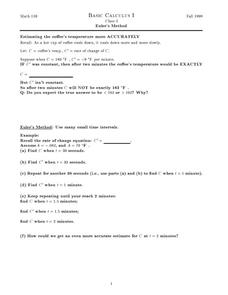
Euler's Method
For this Euler's method worksheet, students use Euler's method to determine one-second time intervals in a rate problem. They explore functions to estimate rate changes in small time intervals. This two-page worksheet contains...
Curated OER
Telling Time by the Half Hour
In this analog clocks activity, students draw hands on the 9 clocks to match the digital times underneath. All times are to the nearest half hour.
Curated OER
What Time is it? (B)
In this telling time review learning exercise, students examine 8 clocks and use their math skills to record the 8 times to the correct 5 minute intervals.
Curated OER
Telling Time By the Hour
In this clocks worksheet, students draw the clock hands to show the time to the hour that is printed underneath each analog clock.
Curated OER
Telling Time Worksheet: What Time is it?
In this telling time activity, students look at each of the clocks on the page and write the correct time on the line below each clock. There are 9 clocks.


