Curated OER
School Yard Waste
Fourth graders examine the types of garbage that they collect on the playground. They collect the information in a spreadsheet and create a graph that displays the number of types of trash found. They design and monitor a playground...
Illustrative Mathematics
Accuracy of Carbon 14 Dating I
Here is an activity that is intended to highlight a very important issue about precision in reporting and understanding statements in a realistic scientific context. Discuss different ways of reporting the half life of Carbon 14...
EngageNY
Graphing the Sine and Cosine Functions
Doing is more effective than watching. Learners use spaghetti to discover the relationship between the unit circle and the graph of the sine and cosine functions. As they measure lengths on the unit circle and transfer them to a...
West Contra Costa Unified School District
Indefinite Integrals
The inverse of matter is anti-matter, so the inverse of a derivative is an antiderivative. The lesson introduces antiderivatives and indefinite integrals to the class along with the notation for integrals. Groups work together to find...
Curated OER
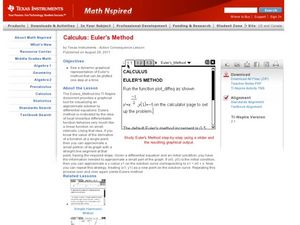
Euler's Method
Learners identify Euler's method of graphing in this calculus lesson. They approximate values of a function and check their work using EM. They also differentiate equations at an exact point.
Curated OER
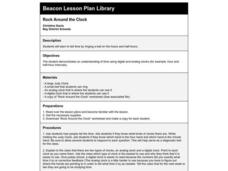
Rock Around the Clock
First graders use a Judy Clock to learn time to the hour and half hour. They practice by ringing a bell and telling the time. They complete an activity sheet after practicing for several days.
Curated OER
Primary Sources and Archaeology in the Study of Ancient Mediterranean Trade
Tenth graders begin the lesson by plotting trade routes, major empires and items traded. Using primary sources, they examine their own values regarding trading items for royality. They participate in a role-play exercise in which they...
Curated OER
The Mathematical Dynamics of Celestial Navigation and Astronavigation
Students explore the different methods used in celestial Navigation and astronavigation. In this math lesson, students construct a sextant and demonstrate how it works.
Curated OER
Technology: Koo Koo for Clocks
Third graders design and make clocks compiling a materials list, creating adesign portfolio, and recording progress in a daily log. After making a full-size drawing of their clocks and with the assistance of high school technology...
Curated OER
A Picture's Worth a Thousand Words
High schoolers analyze the numbers of male vs female administrators and teachers from their school. In this gender equality lesson plan, students use school yearbooks from the 1950's threw present to count how many male vs. female...
Curated OER
The Amazing Heart
Learners examine human blood flow by comparing the pulse of athletes. In this human body lesson plan, students discover the equation for finding the cardiac output from a human heart. Learners identify heart rates of...
Curated OER
Timing the Transit of Venus
Middle schoolers calculate elapsed time and look for patterns.
Curated OER
Definite Integral
Learners investigate the intervals represented by a function in this calculus lesson. They decide what interval of the function will be positive, negative or zero. They are then given graphs of functions and asked to analyze it.
Curated OER
Simple Inequalities on a Number Line
Students solve inequalities problems. In this algebra lesson, students graph the solution of inequalities on a number line. They discuss boundaries and open or closed intervals.
Curated OER
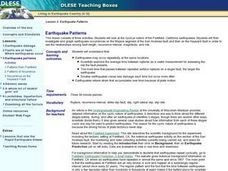
Earthquake Patterns
Students identify and interpret the cyclical nature of the Parkfield, California earthquakes. They then investigate and graph earthquake occurrences on the Mojave segment of the San Andreas fault and then on the Hayward fault in order to...
Curated OER
Exploring the Area Under a Curve
Using TI-89, mathematicians explore and investigate Riemann sums to estimate the area under the graphs of intervals by drawing and illustrating rectangles. They review and practice the concepts of summation notation and area formulas to...
Curated OER
Data Analysis and Probability
Students make their own puzzle grid that illustrates the number of sit-ups students in a gym class did in one minute, then they make a histogram for this same data. Then they title their graph and label the scales and axes and graph the...
Curated OER
MVT for Derivatives
Young scholars find the derivative using the mean value theorem in this calculus lesson. They find the slopes of secant and tangent lines, then analyze the function and identify the slope.
Curated OER
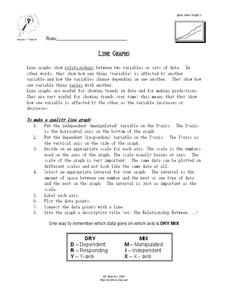
Line Graphs
For this algebra worksheet, students describe the relationship between a line graph and its data. They define the reasons line graphs are used and discuss increasing and decreasing lines. There is one involved questions, requiring...
Curated OER
Slope Fields
Students create and analyze slope fields. In this calculus lesson, students create a visual of differential equations. They use the Ti Navigator to create slope fields.
Curated OER
Riemann Sums
Students calculate the area under a curve. In this calculus lesson plan, students use Riemann Sums to find the area under a curve. They apply the boundaries of intervals as they solve for each area.
Curated OER
The Second Fundamental Theorem of Calculus
Students investigate the fundamental theorem of calculus. In this calculus lesson, students derive the fundamental theorem of calculus. They differentiate between the first and second theorem.
Curated OER
Probabilities for Number Cubes
Students explore the concept of probability. In this probability instructional activity, students roll a six-sided number cube and record the frequency of each outcome. Students graph their data using a frequency chart and...
Curated OER
Average Value of a Function
Students investigate the average value of a function given different interval values. In this calculus lesson plan, students explore word problems and apply their knowledge of average value to find the answer. They apply previous...


