Curated OER
Graphs
Students explore graphs and define the different ways they are used to display data. In this algebra lesson, students collect data and plot their data using the correct graph. They draw conclusions from their graphs based on their data.
Curated OER
Which Car Should I Buy?
Young scholars use gas mileage of different cars to create T charts, algebraic equations, and graphs to show which gets better mileage. In this gas mileage lesson plan, students use the graph to see which car they should buy.
Curated OER
Recording Frequency
First graders analyze nursery rhymes and gather data about word frequency. In this frequency lesson plan, 1st graders create graphs and tables. Students interpret the data.
Curated OER
Earth's Age: The Dating Game
Students conduct a simulation to determine radioactive decay and half-life. Using pennies, dice or sugar cubes as isotopes placed in shoe boxes simulating rocks, they hold five trials representing 1000 years each to find the theoretical...
Pennsylvania Department of Education
Length and Perimeter
Third graders explore tessellations and the spatial concepts used in creating them. In this tessellations instructional activity, 3rd graders rotate, reflect and transform shapes to create tessellations. Students become...
Curated OER
Range and Mode
Fifth graders interpret data. In this mode and range lesson, 5th graders define mode and range and practice finding them given a set of data.
Curated OER
Walking Math into the Real World
Students measure an area given a yardstick. They also convert inches into a fractions of a foot and use data to create a linear graph.
Curated OER
Art Dates
Students use a timeline to measure intervals and calculate the age of works of art.
Curated OER
Basic Ideas of Functions
For this Algebra I/Algebra II worksheet, young scholars determine whether or not a relation is a function. Students determine the domain of a function and express the answer in interval notation. The three page worksheet...
Curated OER
Inquiry Unit: Modeling Maximums and Minimums
Young mathematicians explore the maximun area for patio with the added complexity of finding the mimimum cost for construction. First, they maximize the area of a yard given a limited amount of fence and plot width v. area on a...
Curated OER
Lesson #20 Rates of Change and Velocity
Students investigate speed. For this rate of change lesson, students complete a rate/time/distance table to determine the average m.p.h. of a given trip. They listen and follow along with the lecture and examples to determine the average...
Curated OER
Cannonball
Students calculate the speed, motion and distance of a projectile. In this geometry lesson plan, students obtain measurements while calculating velocity. They graph their results and make predictions.
Curated OER
Creating Line Graphs
High schoolers draw line graphs. In this math instructional activity, students interpret minimum wage data and graph the data in a line graph. High schoolers predict the next minimum wage and figure the earnings for a 40 hour work week...
Curated OER
Shadows
Students conduct an experiment. In this shadows lesson, students record the height of a meter stick. Students then cast shadows and record their length. Students compare the length of the shadow with the actual height of the meter stick.
Curated OER
Linear Functions
Pupils solve and graph linear equations. In this algebra lesson, students collect data and plot it to create a linear function. They identify the domain and range of each line.
Pennsylvania Department of Education
Build What I've Created
n this geometric lesson plan, students define and identify two dimensional shapes based on their attributes. They complete worksheets based on the geometric concepts.
Illustrative Mathematics
Fixing the Furnace
This comprehensive resource applies simultaneous equations to a real-life problem. Though the commentary starts with a graph, some home consumers may choose to begin with a table. A graph does aid learners to visualize the shift of one...
Curated OER
Using Multiplication to Solve Word Problems
Students explore math functions by solving word problems in class. In this multiplication lesson, students utilize colored cubes and base blocks to visualize multiplication problems. Students identify the multiplication values within...
Curated OER
Our Hour
First graders keep track of time throughout the day by recording the time and what activity they are doing at that particular hour. They keep both analog and digital time.
Curated OER
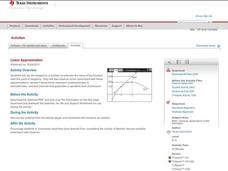
Linear Approximation
Pupils practice examining the tangent to a function to estimate the value of the function near the point of tangency. They view errors associated with those approximations, determine overestimates and find intervals that guarantee a...
Curated OER
The Millikan L'Eggs Experiment
Students discover a pattern to mysterious eggs made by their teacher. In this mass lesson, students must uncover a secret pattern given plastic eggs and a balance. Students find the eggs have been created with a pattern and draw...
Curated OER
Centimeter Slinkies
Third graders estimate and measure the length of a whole color-segmented, candy gummy worm. Then, as students bite off each segment, they estimate, measure and record findings in an activity log.
Curated OER
Sustainability: Our Environment
Students explore the sustainability of our environment, the trend in rising temperatures and the emission of greenhouse cases. Using given data, students test and construct a confidence interval and the difference between two population...
Curated OER
Am I Am I Prime?
Seventh graders determine if a number is prime or composite. In this determining if a number is prime or composite lesson plan, 7th graders use a website to help find all prime numbers between 1 and 100. Students use a...


