Curated OER
Search and Rescue Project
Students create a search and rescue party. In this geometry lesson, students simulate a rescue operation using math. They calculate the time, rate and solve word problems related to the real world.
Curated OER
How Much Will I Spend On Gas?
Students construct a linear graph. In this graphing lesson, students determine a monthly budget for gasoline. Students construct a t-chart and coordinate graph to display data. Resources are provided.
Curated OER
Models and Algorithms to Solve Multiplication Problems
Students choose the correct strategy to solve multiplication and division. For this algorithm lesson, students use at least two strategies that use properties of operations and estimation. Students also recognize the relationship between...
Curated OER
How Do You Rate?
Fifth graders make a graph. In this pulse rate lesson, 5th graders estimate their pulse and record it. Students measure their pulse while at rest and after physical activity and record it. Students use the internet to graph their results...
Curated OER
Speed of a Forest Stream
Students study stream speed. In this stream speed lesson plan students complete an activity and formulate an opinion and study its effects.
Curated OER
Life Expectancy at Birth
Students create a line graph on the life expectancy for males and females in Canada. In this math and health lesson plan, students review table and graph terminology, create line graphs, and analyze the differences in life expectancy...
Curated OER
Graphs
Students investigate circle and bar graphs. In this middle school mathematics lesson, students determine which kind of graph is suitable for a given situation and create circle and bar graphs.
Curated OER
Graphing Valentine Candies
Fifth graders organize and display information in bar graph form using appropriate labels. Each student receives a box of Valentine heart candies, a worksheet of the tally chart and a worksheet of the bar graph.
Curated OER
Perplexing Perimeters
In the process of constructing their own "rulers" Students develop a sense of the size of a centimeter and meter. Students select the appropriate "ruler" for the tasks. Finally, 3rd graders calculate the perimeter of objects using...
Curated OER
Data Analysis
In this data analysis worksheet, pupils solve and complete 4 different types of problems. First, they reduce the data provided to find the means, and graph the means in a line graph. Then, students graph the data from each mixture shown...
Curated OER
From Hypothesis to Conclusion...Reading Maps to Understand Proofs
Tenth graders explore the concept of proof. In this proof lesson, 10th graders work in groups to collectively write proofs for directions to places on a map. Students give directions to specific places in big cities such as from the New...
Curated OER
The Effect of Math Anxiety on Cardiovascular Homeostasis
Students examine the effect stress due to test anxiety may have on the heart. As part of the experiment, students hypothesize, collect data, graph data, analyze data and formulate an understanding of their personal level of stress and...
Curated OER
Rates Of Change
Students investigate the rate of change and how it effects a function over a given interval. They examine the slope of a line that is seccant and how it is compared to a tangent line and then determine the changes of a function at any...
Curated OER
Timed Multiplication Test Graphs
Students use the tools of data analysis for managing information. They solve problems by generating, collecting, organizing, displaying histograms on bar graphs, circle graphs, line graphs, pictographs and charts. Students determine...
Curated OER
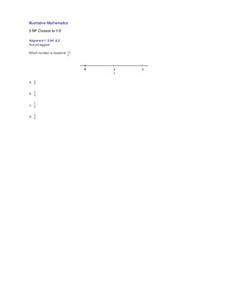
Closest to 1/2
Using a number line, pupils are asked to identify which of four fractions is closest to one half. Includes a single problem that can serve as a practice problem or formative assessment for 3rd or 4th graders learning to partition number...
Curated OER
Graphical Analysis
Get out your TI-nspire graphing calculator and explore polynomials. Learners determine where a given polynomial are increasing or decreasing, find maximums, minimums, and zeros of polynomials, and discuss end behavior of polynomials....
02 x 02 Worksheets
Absolute Value Equations and Inequalities
Demonstrate the meaning of an absolute inequality using three different methods. Here, scholars explore absolute value inequalities through graphing, number line distance, and compound inequalities. Pupils complete various activities to...
EngageNY
Why Do Banks Pay YOU to Provide Their Services?
How does a bank make money? That is the question at the based of a lesson that explores the methods banks use to calculate interest. Groups compare the linear simple interest pattern with the exponential compound interest pattern.
Alabama Learning Exchange
Sky High
How are skyscrapers built? What does it take to make a structurally sound building? How can one work within a budget to complete a building project? These guiding questions will be investigated and answered within a hands-on lesson....
Curated OER
Proposed Problems
In this math worksheet, students find the solutions to the problems that involve solving equations with and without rational expressions.
Curated OER
What percent of ratio is proportion?
Ninth graders investigate the concepts of ratio and proportion.They solve examples with the teacher for ratios and proportions. A basic fraction review is used for a warm up in this instructional activity. The primary focus of the...
Curated OER
Measuring a Mummy Case
Young scholars calculate the size of a mummy case and its contents using ancient Egyptian measurements.
Curated OER
Rover Races
Students identify the challenges encountered by astronauts in operating a planetary rover. In this space science lesson plan, students create a rover using their team members. They follow a command sequence from the driver and navigate...
Curated OER
Hot n' Cold
Students keep a weather log. In this weather and temperature lesson, students discuss the information that can be obtained from a map and lead into a discussion about temperature. Students watch a video about temperature and...


