Curated OER
Time Lesson
Second graders observe a clock and discuss at what time of day they perform a certain task such as what time they wake up, go to sleep, etc. They use a clock and show what time they wake up in the morning differentiating whether it is...
Curated OER
Telling Time
Students tell time. In this ELL vocabulary development and math lesson, students orally tell time to five minute intervals when shown a classroom clock. Students practice using number and "telling time" vocabulary in sentences and...
Curated OER
Snack Time
Students explore mathematics by participating in a snack eating activity. In this math problem solving lesson, students utilize different children's snacks as visual aides in a variety of math problems. Students receive snacks as they...
Curated OER
Math: Odd Object Out
Students discover how to classify and categorize items by sorting various objects. As they sort the items, they explain how the items are alike. By repeating the sorting procedure several times, students determine there are numerous...
EngageNY
Understanding Box Plots
Scholars apply the concepts of box plots and dot plots to summarize and describe data distributions. They use the data displays to compare sets of data and determine numerical summaries.
EngageNY
Constant Rates Revisited
Find the faster rate. The resource tasks the class to compare proportional relationships represented in different ways. Pupils find the slope of the proportional relationships to determine the constant rates. They then analyze the...
EngageNY
Numbers in Exponential Form Raised to a Power
Develop an understanding of the properties of exponents through this series of activities. This third instructional activity of 15 explores the patterns associated with the power property. Scholars expand the powers before applying the...
EngageNY
Percent of a Quantity
Visualize methods of finding percents. Classmates find a percent of a quantity using two methods including a visual model in the 26th lesson plan in a series of 29. By the end of the lesson plan, scholars find percents given a part and...
EngageNY
Word Problems
Use several skills to solve word problems leading to systems of equations. Scholars define variables and write equations to model situations described within word problems. Pupils solve the resulting system of linear equations using...
EngageNY
Comparing Quantities with Percent
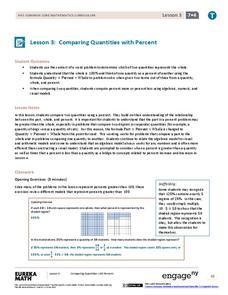
Be 100 percent confident who has the most and by how much. Pupils use percentages to help make the comparisons by finding what percent one quantity is of the other. They also determine the percent differences between the two...
EngageNY
Variability in a Data Distribution
Scholars investigate the spread of associated data sets by comparing the data sets to determine which has a greater variability. Individuals then interpret the mean as the typical value based upon the variability.
EngageNY
Conducting a Simulation to Estimate the Probability of an Event II
Add some randomization into simulations. The 11th installment in a series of 25 presents two new methods to use in simulations--colored disks, and random numbers. Pupils use random numbers to run simulations where the probabilities make...
EngageNY
The Relationship of Multiplication and Addition
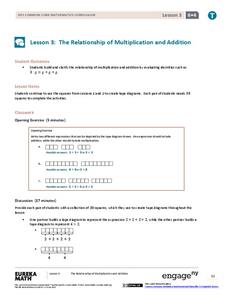
You know 4 + 4 + 4 = 3(4), but what about x + x + x? Pairs work together to develop equivalent expressions relating multiplication and addition in the third instructional activity of a 36-part series. They extend their knowledge of...
EngageNY
Factoring Expressions
Factor in an informative resource when teaching about factoring. The 11th activity in a 36-part module shows pupils how to factor algebraic expressions by applying the distributive property. Some of the problems involve expressions with...
EngageNY
Using Tree Diagrams to Represent a Sample Space and to Calculate Probabilities
Cultivate the tree of knowledge using diagrams with two stages. Pupils create small tree diagrams to determine the sample space in compound probability problems. The lesson uses only two decision points to introduce tree diagrams.
EngageNY
Counting Problems
Solving these percent problems is a matter of counting. Pupils find percents by counting the number of events that meet the criteria and the total number of possibilities. Participants create the ratio and convert it to a percent to...
EngageNY
Percent and Rates per 100
What percentage of your class understands percents? Pupils learn the meaning of percents based upon rates per 100 in the 24th lesson plan in a series of 29. They represent percents as fractions, decimals, ratios, and models. The scholars...
EngageNY
The Opposite of a Number's Opposite
It's said that opposites attract, but what about opposites of opposites? Individuals learn about the opposite of opposites using number lines. They complete a group activity in which members determine the opposite of opposites of...
EngageNY
Creating a Histogram
Display data over a larger interval. The fourth segment in a 22-part unit introduces histograms and plotting data within intervals to the class. Pupils create frequency tables with predefined intervals to build histograms. They describe...
EngageNY
The Relationship of Division and Subtraction
See how division and subtraction go hand-in-hand. The fourth installment of a 36-part module has scholars investigate the relationship between subtraction and division. They learn using tape diagrams to see that they can use repeated...
Curated OER
Pumpkin Predictions
It's time for Halloween and math! Perfect for Fall, this simple worksheet provides a grid for young mathematicians to record their predictions about a pumpkin's height, stem length, diameter, circumference, and weight. After learners...
Illustrative Mathematics
Counting Circles II
Fill those extra ten minutes of math time with this fun counting activity. Given a short sequence of numbers, young mathematicians stand in a circle and count one-by-one until the last number is reached, at which point the whole group...
Education World
Putting Turkey on a Table (or a Graph)
Grateful learners put turkey on a table (or a graph)! Through a creative project they show statistical information about turkey population, production, and consumption. A great Thanksgiving lesson that can be applied at any time to the...
Curated OER
Curve Ball
Create a Height-Time plot of a bouncing ball using a graphing calculator. Graph height as a function of time and identify the vertex form of a quadratic equation that is generated to describe the ball's motion. Finally, answer questions...
Other popular searches
- Time Math Lesson
- Math Time
- Math Telling Time
- Maths Telling Time Clocks
- Math Challenge Problems Time
- Date and Time Math
- Math Lessons Time Duration
- Time Math Lesson Plans
- Canadian Time Zones Math
- Life Skills Math Time
- Time Domino Math Games
- Time Math Curse


