EngageNY
Analyzing Graphs—Water Usage During a Typical Day at School
Connect your pupils to the problem by presenting a situation with which they can identify. Individuals analyze a graph of water use at a school by reasoning and making conclusions about the day. The lesson emphasizes units and...
EngageNY
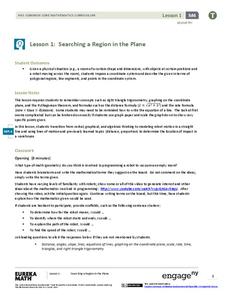
Searching a Region in the Plane
Programming a robot is a mathematical task! The activity asks learners to examine the process of programming a robot to vacuum a room. They use a coordinate plane to model the room, write equations to represent movement, determine the...
EngageNY
Advanced Factoring Strategies for Quadratic Expressions (part 1)
Factoring doesn't have to be intimidating. Build on prior knowledge of multiplying binomials and factoring simple trinomials to teach advanced factoring of quadratic expressions with a instructional activity that uses various methods of...
EngageNY
Constant Rate
Two-variable equations can express a constant rate situation. The lesson presents several constant rate problems. Pupils use the stated constant rate to create a linear equation, find values in a table, and graph the points. The resource...
American Farm Bureau Foundation for Agriculture
Shapes in Agriculture
It's time to get crafty with shapes! Your future farmers demonstrate their geometric ability by building a farm using triangles, circles, rectangles, and squares. But first, scholars take part in a brainstorm session inspired by their...
EngageNY
The Zero Product Property
Zero in on your pupils' understanding of solving quadratic equations. Spend time developing the purpose of the zero product property so that young mathematicians understand why the equations should be set equal to zero and how that...
EngageNY
Graphs of Simple Nonlinear Functions
Time to move on to nonlinear functions. Scholars create input/output tables and use these to graph simple nonlinear functions. They calculate rates of change to distinguish between linear and nonlinear functions.
EngageNY
Modeling with Inverse Trigonometric Functions 1
Where should I stand to get the best view? Pupils use inverse trigonometric functions to determine the horizontal distance from an object to get the best view. They round out the lesson by interpreting their answers within context.
EngageNY
Efficacy of Scientific Notation
How many times could California fit into the entire United States? Pupils use scientific notation to find the answer to that question in the 12th installment of 15 lessons. It asks scholars to write numbers in scientific notation and...
EngageNY
The Decimal Expansion of Some Irrational Numbers
Develop a definition of irrational numbers through an exploration of square roots. The 11th instructional activity in this series of 25 asks scholars to estimate the value of a square root. Learners observe as the estimation extends...
EngageNY
Decimal Expansions of Fractions, Part 2
Develop your pupils' understanding of fractions and their decimal equivalence using the 12th lesson in this series. Scholars learn an alternative to long division that results in converting fractions to decimals that emphasize fractional...
EngageNY
Rational Numbers on the Number Line
Individuals learn how to plot rational numbers on the number line in the sixth lesson of a 21-part module. They identify appropriate units and determine opposites of rational numbers.
EngageNY
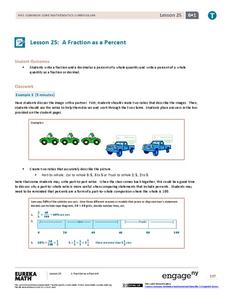
A Fraction as a Percent
It is all about being equivalent. Class members convert between fractions, decimals, and percents. By using visual models, scholars verify their conversions in the 25th portion of a 29-part series.
Curated OER
Math Activity File
Third graders describe the difference between area and volume and also explain how various units of measure relate to one another.
National Research Center for Career and Technical Education
Business Management and Administration: Compound Interest - A Millionaire's Best Friend
Many math concepts are covered through this resource: percentages, decimals, ratios, exponential functions, graphing, rounding, order of operations, estimation, and solving equations. Colorful worksheets and a link to a Google search for...
EngageNY
Square Roots
Investigate the relationship between irrational roots and a number line with a resource that asks learners to put together a number line using radical intervals rather than integers. A great progression, they build on their understanding...
EngageNY
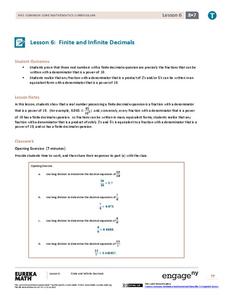
Finite and Infinite Decimals
Explore the patterns of fractions that produce finite and infinite decimals. The sixth lesson of the series asks learners to determine a similar feature of fractions that produce finite decimals. Using the patterns, pupils create...
EngageNY
Using Tree Diagrams to Represent a Sample Space and to Calculate Probabilities
Cultivate the tree of knowledge using diagrams with two stages. Pupils create small tree diagrams to determine the sample space in compound probability problems. The lesson uses only two decision points to introduce tree diagrams.
EngageNY
Ordering Integers and Other Rational Numbers
Scholars learn to order rational numbers in the seventh lesson in a series of 21. Reasoning about numbers on a number line allows for this ordering.
EngageNY
Factoring Expressions
Factor in an informative resource when teaching about factoring. The 11th activity in a 36-part module shows pupils how to factor algebraic expressions by applying the distributive property. Some of the problems involve expressions with...
EngageNY
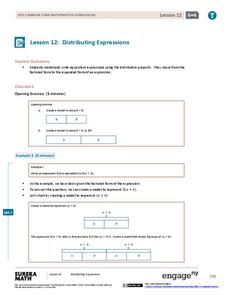
Distributing Expressions
You know how to factor expressions; now it's time to go the opposite way. Scholars learn to write algebraic expressions in expanded form using the distributive property. A problem set helps them practice the skill.
EngageNY
Comparing Data Distributions
Box in the similarities and differences. The 19th lesson in a unit of 22 presents class members with multiple box plots to compare. Learners use their understanding of five-number summaries and box plots to find similarities and...
Ohio Literacy Resource Center
Solving Systems of Linear Equations Graphing
Do you need to graph lines to see the point? A thorough lesson plan provides comprehensive instruction focused on solving systems of equations by graphing. Resources include guided practice worksheet, skill practice worksheet,...
EngageNY
Distributions and Their Shapes
What can we find out about the data from the way it is shaped? Looking at displays that are familiar from previous grades, the class forms meaningful conjectures based upon the context of the data. The introductory lesson to...
Other popular searches
- Time Zone Lesson Maths
- Math Lessons Time Duration
- Time Math Lesson Plans
- Math Lessons Time
- Maths Time Lesson
- Christmas Math Lesson on Time
- Math Lessons on Time
- Maths Time Lesson Plans
- Math Lessons Telling Time


