Curated OER
Linear Programming
In this algebra worksheet, students calculate the maximum and minimum of a shaded region. They identify the boundaries and their vertices's. There are 2 problems.
Agile Mind
Cake Weighing
An online set of four yummy questions addresses number sense for sixth graders. They place points on a number line, determine relative values, interpret absolute value, and apply their understanding to the weighing of cakes for a bakery....
Illustrative Mathematics
Buying Bananas, Assessment Version
Practice with unit rates, proportions, and ratios when Carlos purchases an amount of bananas. Learners must interpret a graph to decide whether points on the same line represent similar proportional relationships. Use with lesson plans...
Mathematics Vision Project
Module 2: Systems of Equations and Inequalities
The brother-sister pair Carlos and Clarita need your class's help in developing their new pet sitting business. Through a variety of scenarios and concerns presented to the siblings, the learners thoroughly explore systems of equations...
West Contra Costa Unified School District
Solving Systems of Inequalities
Don't throw away those transparency sheets just yet! Young scholars first review inequalities on a number line, then learn about graphing inequalities in the coordinate plane. Finally, they use overhead transparencies to create systems...
Curated OER
Skittles Galore!
Youngsters show understanding of accurate division of whole number, decimals, fractions, and percents using manipulatives (candies). They use white boards to demonstrate their understanding of representing numbers as defined in the...
Curated OER
Piles of Paper
Track how much paper their class uses in a week. They will pile their used paper into one place, each day the pile is measured. They make predictions about how much paper they would collect in a month, then recycle the paper.
Curated OER
Conditional Probability and Probability of Simultaneous Events
Your statisticians examine the characteristics of conditional probability and the probability of simultaneous independent events. They perform computer activities to find probabilities for simple compound events. They examine the...
Curated OER
World of Work
Twelfth graders research want ads on the Internet or in the newspaper. They calculate the estimated weekly, monthly, and yearly pay for an hourly, salary and commission positions. They calculate a paycheck including state tax, federal...
Curated OER
Building Your Space Station
High schoolers discuss the benefits of the International Space Station. They evaluate the challenges the designers faced when trying to design the space station. Students discuss the use of scale models when designing large structures...
Ohio Department of Education
Number Subsets: Winning the Number Game - Grade Eight
Young leearners identify subsets of the real number system and play a number game to identify natural numbers, whole numbers, integers, rational and irrational numbers.
Illustrative Mathematics
Fruit Salad
Playing with values in this fruit salad problem allows learners to find out how many cherries were mixed in. Your middle schoolers can organize their thoughts in a chart before going into the equation. Eigth graders can skip the chart...
Curated OER
Weather Watchers
Students identify basic weather instruments and how they are used to record weather data. Students define several vocabulary terms as stated in lesson. Students use basic instruments to record weather data in their area. Students use the...
Curated OER
Let's Plot Points
Use coordinate grid paper to plot points and identify shapes that are already plotted on the paper by saying their coordinates. Pupils also measure the distance between points and play the game Battleship. There are several web links and...
Google
The Law of Large Numbers and Probability
Learners investigate why theoretical probability doesn't always match reality. The activity involves using Python 2.7 (or Sage) to set up a Bernoulli Trial. It also involves setting up a spreadsheet to simulate the Birthday Paradox....
Curated OER
Mean, Median, and Mode
Show scholars the three ways to find an average: mean, median, and mode. They reference a guided example before doing these on their own. There are three sets of data and learners find the three averages for each. All...
Curated OER
Put Your Truss in Building Bridges
Young scholars apply abstract concepts, such as stress, fulcrums, the law of gravity, and the strength of different geometric shapes. Groups of student contractors operate simulated architectural firms to create strong, economical bridges.
Curated OER
How Long Can You Go?
Eighth graders examine the usefulness of a line of best fit by collecting and graphing data, using a graphing calculator to determine the line of best fit, and making a variety of predictions. They watch a video, then design a...
Curated OER
Living in a Geometrical World
Students participate in a series of hand-on, online, and multimedia activities to examine 2 dimensional and 3 dimensional shapes. They describe common geometric solids. They construct rectangular prisms using straws and ribbon.
Curated OER
Line of Best Fit
In this line of best fit activity, students solve and complete 8 different problems that include plotting and creating their own lines of best fit on a graph. First, they study the samples at the top and plot the ordered pairs given on...
Curated OER
Fraction Games
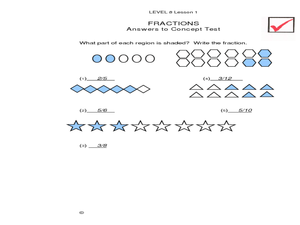
Explore fractions with upper graders. They will discover how to show fractions by shading the correct amount shown in a picture (giving them the idea behind part to whole). They also play multiple fraction games using dice, matching...
Curated OER
Lesson #46: Bar Graphs and Line Graphs
In this bar graphs and line graphs worksheet, students interpret bar graphs, line graphs, and box-and-whisker plots. They find the measures of central tendency. This three-page worksheet contains notes, vocabulary, and...
Curated OER
Tuck Everlasting
Clearly written as an assignment for a higher-level education class, this formal lesson plan contains some fun and well-researched strategies for teaching the novel Tuck Everlasting by Natalie Babbitt. Among the best ideas...
Curated OER
Sitting across from Each Other
What is the probability that two randomly seated people will be across from each other at a square table? Check learners' understanding of theoretical probability and compound events with this short assessment. A great opportunity to...


