Curated OER
The Delicate Balance - Iowa's Natural Resources
Discover the natural resources in Iowa by studying it's history. In this environmental lesson, your students will observe a topographical map of Iowa and identify where its most valuable resources are. They complete an Iowa name...
Curated OER
Geologic Mapping I
Students create a geologic map and cross-section of an area of horizontal sedimentary rocks, exposed in several locations. Map must include a complete key or legend with rock descriptions of the various formations.
Curated OER
MAPPING THE TOPOGRAPHY OF UNKNOWN SURFACES
Students describe in words and graphic displays the elevation or depression profile of sections of Mars' Olympus Mons and/or Valles Marineris. They explain how orbiting spacecraft build up global maps one data slice at a time.
Curated OER
Geologic cross section of Manhattan, NYC
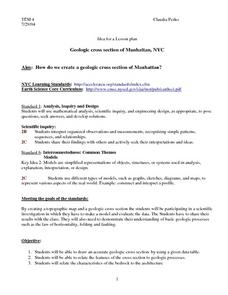
High schoolers draw an accurate geologic cross section by using a given data table. They relate the features of the cross section to geologic processes. Students then relate the characteristics of the bedrock to the architecture.
Curated OER
Plotting the Ocean Floor
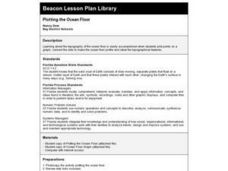
Fourth graders plot points on a graph, connect the dots to make the ocean floor profile and label the topographical features. They utilize a worksheet and a website imbedded in this plan to plot the ocean floor.
Curated OER
Comparison of Snow Cover on Different Continents
Learners use the Live Access Server (LAS) to form maps and a numerical text file of snow cover for each continent on a particular date. They analyze the data for each map and corresponding text file to determine an estimate of snow cover...
Curated OER
Burt County, NE, Soil Survey
Students identify the soil types and textures, and locate the waterways in or near the towns of Lyons and Decatur, Nebraska. They analyze soil profile maps, and answer conclusion questions.
Curated OER
Snow Cover By Latitude
Students create graphs comparing the amount of snow cover along selected latitudes using data sets from a NASA website. They create a spreadsheet and a bar graph on the computer, and analyze the data.
Curated OER
Natural Hazards
High schoolers evaluate the hazards of naturally occurring events. After watching a video concerning safety hazards, students work in groups to discuss the safety issues involved in taking a trip to a mountainous region. ...
Curated OER
Geography: Snow Cover on the Continents
Young scholars create maps of snow cover for each continent by conducting Internet research. After estimating the percentage of continental snow cover, they present their findings in letters, brochures or Powerpoint presentations.
Curated OER
Floodplains in the Field
Students measure a topographic and geologic cross-section across a floodplain using simple surveying and auguring techniques in a field lab. Students also reconstruct the history of a river system.
Curated OER
Snow Cover By Latitude
Students examine computerized data maps in order to create graphs of the amount of snowfall found at certain latitudes by date. Then they compare the graphs and the data they represent. Students present an analysis of the graphs.
Curated OER
Cherishing the Water of Life
Students work in small groups to brainstorm a list of all creatures, plants, natural, and artificial processes that use or depend on fresh water. The class views an aquarium filled with water representing all the water in the world. The...
Curated OER
Scientist Tracking Network
Students correlate surface radiation with mean surface temperature of several geographic regions. They observe how these parameters change with latitude and construct an understanding of the relationship of solar radiation to seasonal...
Curated OER
Analysis of Atmospheric Conditions for a High Mountain Retreat
Students examine the relationship between altitude, atmospheric pressure, temperature and humidity at a particular location. They practice science and math in real world applications. They write reports detailing their scientific...
Curated OER
High Mountain Retreat
Students explore and analyze atmospheric conditions for a high mountain retreat. They examine the relationship between altitude, atmospheric pressure, temperature and humidity at a particular location. In addition, they write reports...
Curated OER
Fostering Geospatial Thinking: Space to Earth: Earth to Space (SEES)
High schoolers locate and access data to help them with their science inquiry. In this geographical positioning lesson students evaluate and compare data sets.
Curated OER
Linkages Between Surface Temperature And Tropospheric Ozone
Students collect and interpret data to make predictions about the levels of ozone in the atmosphere. Using the internet to collect data students use their collected data to create a line graph for analysis. Students make mathematical...
Curated OER
Creating and Analyzing Graphs of Tropospheric Ozone
Students create and analyze graphs using archived atmospheric data to compare the ozone levels of selected regions around the world.
Curated OER
Using My Nasa Data To Determine Volcanic Activity
Students use NASA satellite data of optical depth as a tool to determine volcanic activity on Reunion Island during 2000-2001. They access the data and utilize Excel to create a graph that has optical depth as a function of time for the...
Curated OER
Linkages Between Surface Temperature And Tropospheric Ozone
Students organize and analyze data regarding changes in tropospheric ozone and then hypothesize about the consequences of these changes.
Science Education Resource Center at Carleton College
Serc: Topographical Maps, Contour Lines and Profiles
In this mapping field lab students determine the elevation of a given object in a designated area on the school campus using cartography tools. Then they use of these tools to create a contour map of the area.
Geographyiq
Geography Iq
Detailed geographical information on any country is available at this site. Within the World Map section, you can get facts and figures about each country's geography, demographics, government, political system, flags, historical and...


