Curated OER
Fast Food Survey Using Bar Graphs
Second graders create a bar graph to pictorically represent the data collected from a survey of students. They use Excel to electronically create the graphs and data tallies. They then interpret their data using sentences to explain.
PBS
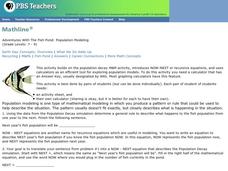
Adventures With The Fish Pond: Population Modeling
Build up from the previous activity where your learners charted the population growth and decay of a fish pond with M&Ms®. Have them look at the data from that activity and create a Now-Next, or recursive equations, to predict the...
Curated OER
The Hudson's Ups and Downs
Fifth graders practice interpreting line graphs of the Hudson River water levels to assess the tides and tidal cycles in the estuary. They explore how weather can affect water levels and tides and observe that high tides and low tides...
Curated OER
Tracking the Salt Front
Using the Hudson River as the focus, learners discuss the difference between salt water and fresh water environments, analyze maps and graphs, and complete addition and subtraction problems. This activity comes with a wealth of...
Curated OER
Hot Time in the Classroom
Fourth graders, in groups, examine how temperature is a measure of the average translational kinetic energy.
Curated OER
Water in the Texas Coastal Basins
Students, after researching a Texas coastal basin, map and graph the information they collect and then translate it into a short report to be presented to their classmates. They brainstorm unique ways to maintain Texas estuaries as well...
Curated OER
Vectors: How Much Force Can You Apply
This lesson entails the viewing of two videos to get an overview of force and its application. The lesson covers how vectors use force in real-world situations.
Curated OER
Finding the Salt Front
Pupils discuss definitions of estuary, salinity, and the salt front. They listen as the teacher explains the Hudson River Miles and ways the upriver and downriver sections relate to the north and south. Students graph the salt front...
Curated OER
Water: On the Surface and in the Ground
Students explore the differences between surface water and ground water. They collect data using maps and graphs and investigate a Texas river basin and a nearby aquifer. They complete a written report including maps and data regarding...
Curated OER
Ecology - Biodiversity Lab
Studnents examine the degree of biodiversity that exists in one's everyday environment, in order to develop an understanding of how scientists classify organisms and to explain why biodiversity is important for living things.
Curated OER
Weather the Storm
Fourth graders complete multi-curricular activities for weather. In this weather lesson, 4th graders complete creative writing, research, and weather data analysis activities for the lesson.
Curated OER
Looking into Eratosthenes' Radius of the Earth
Students, in small groups, research Eratosthenes and his calculations of the Earth's radius. They write a summary of the person, the experiments and his calculations to determine how accurate Eratosthenes was in his estimations of the...
Curated OER
Energy, Work and Power
In this energy, work and power worksheet, students solve 12 problems about circuits, electric motors, Ohm's Law and electric currents.


