Curated OER
MOBILITY, Bike Rack Remix
Students examine how riding a bike can impact the environment and cut down on carbon emissions. In this environmental lesson students design a bike rack that is made from recycled material.
Curated OER
Answer the Questions Based on Venn Diagram
In this venn diagram learning exercise, students answer five questions about ways children get to school. The venn diagram has three overlapping circles and lists three ways students may get to school (walk, bike and car).
Curated OER
Brain Teaser - Dingy
In this logic worksheet, students solve a word problem using logic about crossing animals over a river. Students complete 1 problem.
Curated OER
How Does It Move?
Students listen to the song, The Wheels on the Bus. They attempt to sing the song again, but change it for a tractor. They watch the book, A Visit With Grandma, through a projector, LCD panel, or big screen television and develop their...
Curated OER
Are We There Yet?
Students continue to study rhyming words. They use words and illustrations to help develop their vocabulary.
Curated OER
Miami Seaquarium and Mathematics
Eighth graders, in groups, go on an imaginary field trip to Miami Seaquarium and figure out what the total cost of the trip would be.
Curated OER
Watershed Investigations
Pupils explore the components of a watershed and the factors that affect it. They read a topographical map and use geometry to determine the area of a watershed. Students estimate the volume of a body of water and perform runoff...
Curated OER
The Best Vacation Ever
Students research various vacation destinations and the costs of travel. In this vacation planning activity, students obtain information for various purposes, research sites, document their findings, learn about geographical regions, and...
Curated OER
Ancient Egypt
For this Ancient Egypt worksheet, students read a 2 page article on Ancient Egypt, answer 3 statements as true or false and choose which multiple choice answers best answers 3 questions/statements.
Curated OER
Statistical Diagrams
In this statistics worksheet, students explore five activities that require analysis and interpretation of maps, charts, and scatter plots. The six page lesson includes five activities or experiments with short answer...
Curated OER
Sorting
Students explore how books are sorted in a library. In this sorting instructional activity, students play a game where they have to fill the shelves with books that share a common theme. Students compare this game to a real library....
Curated OER
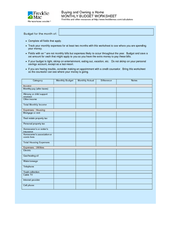
Buying and Owning a Home: Monthly Budget Worksheet
In this personal finance worksheet, students complete the graphic organizer as they chart the 40 listed monthly expenses for 2 months.
Curated OER
Human Activity and the Environment
Learners review and analyze graphs and tables as a group. They develop their graph and data analysis skills by converting data tables from Human Activity and the Environment into graphs.
Curated OER
Communicate with a Truck Driver
Students explore the communication methods of truck drivers and their experiences. In this truck driving lesson, students use a website, Twitter, and Podcasts to learn about the job of a truck driver and their contributions to...
Curated OER
The Great Race: From Anchorage to Nome
Students study the history of the Iditarod sled dog race. They research facts related to biology, sled dogs, and geography in order to put that history in perspective.
Curated OER
The Circus Train
Students study the safety message "Stay Back from tracks and trains!" students count animals and train cars, and repeat The Circus Train poem
Curated OER
Patchwork Quilts
Fourth graders examine about traditional quilting patterns, the symmetry in such patterns, and practice creating patterns of their own. They design a quilting pattern, and groups make colorful "patches," of a pattern. They assemble the...
Curated OER
Your Food Dollar (and Cents)
Students examine where their food dollars go while recognizing coins and making change. They identify their favorite foods, receive one dollar, and take away amounts for each person involved in the production of their food dollar.
Curated OER
Tulip Graphing
Students create a graph of tulip growth. In this data analysis lesson, students plant tulip bulbs and use graph paper to begin graphing data on the growth of the tulip.
Curated OER
If you are asked to convert a distance from hectometers to centimeters, how would you go about it?
Fourth graders convert measurements in the metric system. In this metric lesson plan, 4th graders convert units up to kilometers and down to millimeters. They answer word problems with conversions.
Curated OER
Immigration Graphs
Fourth graders study immigration. In this graphing activity, 4th graders make a population graph of people who have immigrated to Indiana.
Curated OER
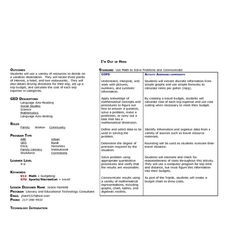
I'm Out of Here
Students create a travel budget. In this budget lesson plan, students research vacation destinations. Working independently, students research destinations on the Internet and construct a budget for the vacation. Resources provided.
Curated OER
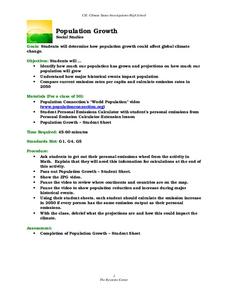
Population Growth
Learners calculate human emission rate by year 2050. For this social studies lesson, students watch a video online and analyze population trends. They explain how e total emissions affect global climate.
Curated OER
Adding Pennies, Nickels and Dimes
Students add pennies, nickels and dimes and organize the coins to display a variety of price values from real life examples. They discuss the importance of money in the day-to-day world.


