Teach Engineering
Energy on a Roller Coaster
Roll with your class into the idea of conservation of energy. Pupils use a roller coaster track to collect data to reinforce the concept of conservation of energy and the influence of friction. Class members then create a graph from...
National Security Agency
Classifying Triangles
Building on young mathematicians' prior knowledge of three-sided shapes, this lesson series explores the defining characteristics of different types of triangles. Starting with a shared reading of the children's book The Greedy Triangle,...
University of Nottingham
Drawing to Scale: A Garden
See how design and geometry go hand in hand. The activity asks learners to use geometry to design a backyard garden given dimensions of each feature. Scholars work with ratios and scale to develop an accurate scale drawing that includes...
Teach Engineering
Building a Barometer
Forget your local meteorologist — build your own barometer and keep track of the weather with an activity that provides directions to build a barometer out of a narrow necked bottle, a glass, and some water. Using their barometer, teams...
Sea World
Ocean Discovery
Immerse your young marine biologists in the world of marine animals. The lesson includes several activities that are age-appropriate for preschoolers and kindergartners, including coloring pages, gluing feathers and sand onto paper...
Mathematics Assessment Project
Solving Problems with Circles and Triangles
After completing a task involving examining the ratio of areas of triangles and circles in a given figure, scholars examine sample responses to identify other strategies they could use to solve the problem.
Teach Engineering
The Amazing Red Planet
Introduce your class to Mars with a resource that provides information about its size, location, length of day, length of year, number of moons, and average temperature. Also includes is information about the lans for past and future...
Cornell University
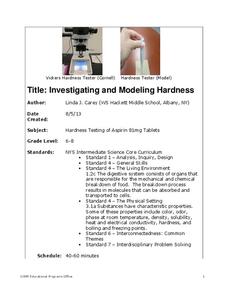
Investigating and Modeling Hardness
Model hardness testing with a self-designed hardness test. Young scholars rate the hardness of different types of aspirin using the Vicker's Hardness scale. They then relate hardness to the solubility of each aspirin tablet.
Teach Engineering
An Inflated Impression of Mars
Help your class understand the magnitude of the distance between Earth and Mars with an activity that asks small groups to use balloons to create scale models of the Earth, Moon, and Mars. Class members figure out the distances between...
NASA
Cleaning Water
From their sweat to the water vapor in their breath, astronauts recycle every possible drop of water while in space. After watching a short video describing the different ways materials are recycled and reused in space shuttles, young...
Teach Engineering
Portable Wheelchair Ramp Challenge
Ramp up the engineering design process in your classroom with an activity that challenges teams to design, build, and test a small-scale portable wheelchair ramp. The class develops design requirements, and teams test their designs using...
Inside Mathematics
Vencent's Graphs
I like algebra, but graphing is where I draw the line! Worksheet includes three multiple-part questions on interpreting and drawing line graphs. It focuses on the abstract where neither axis has numbers written in, though both are...
American Statistical Association
EllipSeeIt: Visualizing Strength and Direction of Correlation
Seeing is believing. Given several bivariate data sets, learners make scatter plots using the online SeeIt program to visualize the correlation. To get a more complete picture of the topic, they research their own data set and perform an...
Mathematics Assessment Project
Deducting Relationships: Floodlight Shadows
Try to figure out what happens with shadows as a person moves between two light sources. A formative assessment lesson has individuals work on an assessment task based on similar triangles, then groups them based on their assessment...
Illustrative Mathematics
Accuracy of Carbon 14 Dating II
The scientific issue of carbon-14 dating and exponential decay gets a statistics-based treatment in this problem. The class starts with a basic investigation of carbon content, but then branches out to questions of accuracy and ranges of...
Chicago Botanic Garden
Weather or Not
What is the difference between weather and climate? This is the focus question of a lesson that takes a deeper look at how weather data helps determine climate in a region. Using weather and climate cards, students decide if a statement...
Curated OER
The Game is Afoot - A Study of Sherlock Holmes
Mystery is an exciting genre for young readers to investigate. The plots are so intriguing! Here is a series of lessons featuring Sherlock Holmes stories that invite learners to enter the world of the mystery genre. Based on what they...
Teach Engineering
Designing a Spectroscopy Mission
In this mind-bending activity, young engineers explore this question of whether or not light actually bends. Using holographic diffraction gratings, groups design and build a spectrograph. The groups then move on research a problem...
Teach Engineering
Android App Development
Building an accelerometer app for your Android device. Groups develop an app that uses the accelerometer on an Android device. The purpose of the activity is to reinforce the programming design. The post activity assessment challenges...
Kentucky Educational Television
The Road to Proportional Reasoning
Just how big would it really be? Young mathematicians determine if different toys are proportional and if their scale is accurate. They solve problems relating scale along with volume and surface area using manipulatives. The last day of...
Chicago Botanic Garden
Historical Climate Cycles
Scientists use ice core samples to obtain temperatures of the earth from 400,000 years ago! The third of five lessons instructs pupils to interpret historical climate data to see changes over time. In part I, participants interpret...
Statistics Education Web
I Always Feel Like Somebody's Watching Me
Future statisticians and potential psychics first conduct an experiment to collect data on whether a person can tell if someone is staring at them. Statistical methods, such as hypothesis testing, chi-square tests, binomial tests, and...
Virginia Department of Education
Logarithmic Modeling
Explore logarithms and logarithmic regression. Young mathematicians first learn about inverse functions and about the logarithm function family. They take their newfound knowledge to use logarithmic functions to model situations and...
Cornell University
Unknown Powders
Create a little scientific magic within your classroom! Learners mix powders and liquids and identify chemical reactions. Based on the reactions, individuals determine the identity of various powders.


