Curated OER
Making Sense of the Census
Students problem solve the mean and median of agricultural data by completing a worksheet. They discuss the results of the statistical data.
Curated OER
What's the Point?
Students learn why the census makes a difference. In this U.S. Census lesson plan, students identify who uses census data and how, trace the impact of census data from Census 2000, and present findings in a graphic format.
Curated OER
Technology - Data Collection
Students collect and analyze data from the United States Census Bureau. Using spreadsheet technology, students explore their results and make preductions about income groups. Students compute the mean, median and mode. They create...
Curated OER
Population Pyramids
Learners work with and make population pyramids. In this population pyramid lesson, students use census data to make population pyramids for China, India, and the United States. They use the information to determine why jobs are leaving...
Curated OER
Making a Report to President Washington
Young scholars gain an understanding of some of the challenges the U.S. faced at its birth. They are asked to compose a report on the state of the nation in 1790 (addressed to President George Washington), which includes a narrative,...
Curated OER
The Hispanic Migration into Iowa
Sixth graders examine the positive and negative effects of the migration of people of Hispanic descent in the state of Iowa. They examine and interpret census data using maps before comparing the positives and negatives. They read...
Curated OER
Cities
Students examine U.S. Census figures. In this urban centers lesson plan, students compare city populations across the span of 50 years. Students create line graphs based on the data.
Curated OER
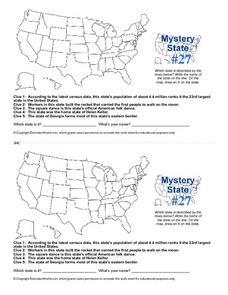
Mystery State #27
In this mystery state activity, students answer five clues to identify the state in question. They then locate that state on a map.
Curated OER
How Much is There to Eat?
Students examine food production related to population density. In this interdisciplinary lesson, students gather data regarding food production in the American South and in India. Students follow the outlined steps to calculate the...
Curated OER
World Statistic Day
Eleventh graders collect data about the state they live in. In this statistics lesson, 11th graders collect and analyze data as they compare themselves to students in other states. They analyze data about a person's education level, and...
Curated OER
Exploring Racial and Ethnic Diversity
Students explore and examine racial and ethinic diversity in the metropolitan areas of the United States. They examine data from the US Census Description of Race and Ethnic Categories. Students explore the population by race and...
Illustrative Mathematics
Electoral College
A cross-curricular resource that takes the electoral votes and allows your learners to organize and analyze the data. Young voters can determine which states are more influential and interpret the dotplot provided for more data....
Curated OER
Slavery by the Numbers
Students examine the role of slavery in the United States. In this American history instructional activity, students watch segments of the video "Slavery and the Making of America." Students conduct further research pertaining to Thomas...
Curated OER
A Nation Counts
Students explore the functions of the U.S. Census. In this civics lesson plan, students understand the origins of the census and its role in U.S. history, recognize the political importance of apportionment based purely on population,...
Curated OER
What Do You Know?
Students learn why the census makes a difference. In this U.S. Census lesson plan, students demonstrate knowledge and understanding of the census and its importance.
Curated OER
Slavery By The Numbers
Students connect episodes in the history of slavery with larger demographic trends. They locate statistical information using census data from the United States Historical Census Data Browser.
Curated OER
Census Statistics and Graphing
Students graphically represent data from the Census. In this middle school mathematics lesson, students investigate the housing characteristics of different tribes of Native Americans and compare them to the average American...
Curated OER
Fascinating Geography Facts
In this geography worksheet, students will read 4 interesting United States geography facts and 19 fascinating world geography facts.
Curated OER
Celebrating Our Nation's Diversity
Second graders conduct a class census to measure diversity.
Curated OER
Lesson 4: A Class Census
Learners compile results in their own census. For this early childhood U. S. Census lesson plan, students collect and represent information about events in simple charts.
Curated OER
How Does Your Population Grown?
Do you know how the population has grown of your community? Can you predict the population over the next half century? Can we find an algebraic model that matches our data? These along with many more questions can be researched by...
Curated OER
Drug Sales Soar: Bar Graph
In this graphs worksheet, students analyze a bar graph that shows retail prescription drug sales in the U.S. Students complete five problem solving questions about the data on the graph.
Curated OER
What is the Population Distribution of Cartoon Characters Living On the Pages of Your Newspaper?
Students read various cartoons in their local newspaper and calculate the population demographics, spatial distribution and grouping of the characters. Using this information, they create a population distribution map and share them with...
Curated OER
Modeling Population Growth
Learners investigate the reasons for taking a census and determine the problems that are involved in the process. They examine the population figure for Montana and Lake county before using the information to complete the included...


