Other
Centre for Topographic Information: Map Scale
This resource uses illustrations to demonstrate scale. Check out the links to the The National Topographic System of Canada and the Aerial Survey Data Base.
CK-12 Foundation
Ck 12: Measurement: Scale Factor to Find Actual Dimensions
[Free Registration/Login may be required to access all resource tools.] Use scale factor to find actual dimensions from scale models, drawings or maps.
Better Lesson
Better Lesson: Scale Drawings
This lesson will provide students the opportunity to work with scale drawings as they create their own road trip to see how far they go using a map of the United States.
CK-12 Foundation
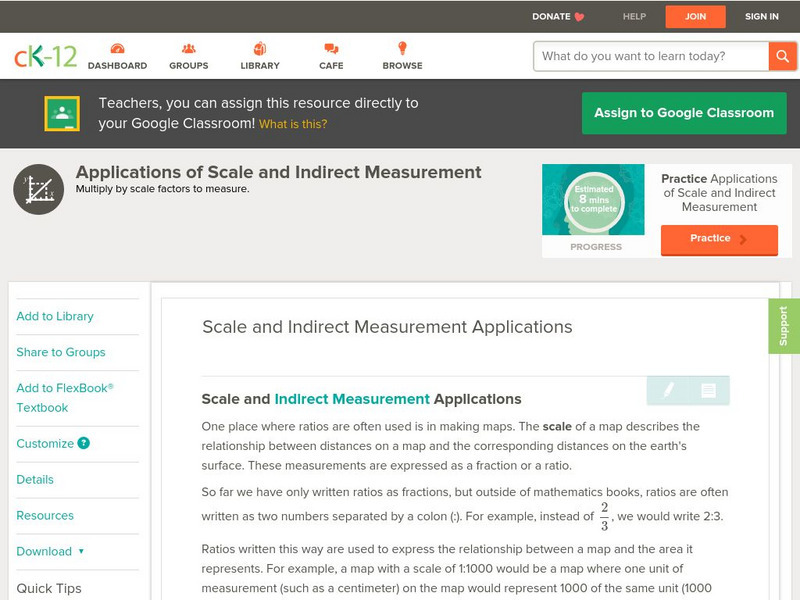
Ck 12: Algebra: Scale and Indirect Measurement Applications
[Free Registration/Login may be required to access all resource tools.] Use map scales and proportions to solve for unknown distances.
E-learning for Kids
E Learning for Kids: Math: Tea Store: Position on a Map
Help Gina locate items in the tea store using coordinates, a compass, and a ruler in this series of leveled exercises.
TeachEngineering
Teach Engineering: Topo Map Mania!
Maps are designed to allow people to travel to a new location without a guide to show the way. They tell us information about areas to which we may or may not have ever been. There are many types of maps available for both recreational...
University of Oregon
University of Oregon: Interactive Nolli Map of Rome: 1748 Map of Rome
Interactive Nolli Map introduces students to Rome and the structure of its urban form based on the work of eighteenth-century Italian architect Giambattista Nolli. Using the map engine, navigate through the city at a variety of scales,...
Curated OER
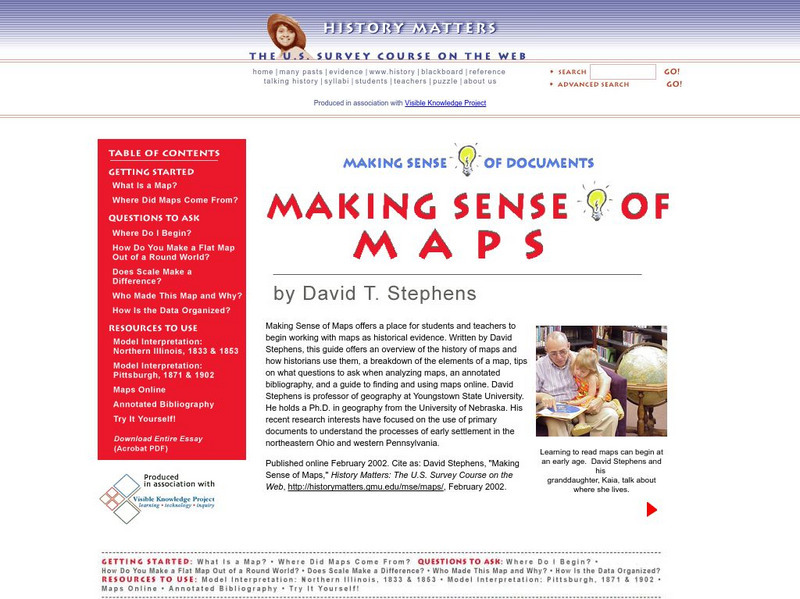
History Matters: Making Sense of Maps
Very detailed site from History Matters containing an explanation of how to read maps and understand them. An excellent resource for teachers. The site covers how to begin, how to use a scale, how to create a flat map for a round world,...
American Geosciences Institute
American Geosciences Institute: Earth Science Week: Houston Activity: Texas Rocks
Using a geologic time scale and map students investigate the rocks in their area.
PBS
Pbs Learning Media: Aiming for the Basketball Hall of Fame
In this video segment from TV 411, two Atlanta Hawks players plan a driving route to reach the Basketball Hall of Fame. They use map scales to estimate their travel distances.
Illustrative Mathematics
Illustrative Mathematics: 7.g Map Distance
This lesson plan has students solve problems using scale drawings on a map.
National Association of Geoscience Teachers
Nagt: Bringing the Geologic Time Scale Down to Earth in the Students' Backyard
This activity is specifically designed for a field trip to Drayton Hall, which is a historic plantation near Charleston, South Carolina. It does provide a model of how a similar activity could be designed for a local area, and there are...
National Association of Geoscience Teachers
Quaternary Glacio Fluvial History of the Upper Midwest Using Anaglyph Stereo Maps
Students examine the anaglyph stereo map and use textures to generate a surficial geology map of the Upper Midwest. They can then interpret the textures in terms of landforms, geomorphic features, and earth-surface processes, as well as...
PBS
Pbs Mathline: Blazing the Trail Lesson Plan [Pdf]
Using a scale, determine the distance between landmarks on a map. Printable lesson.
TeachEngineering
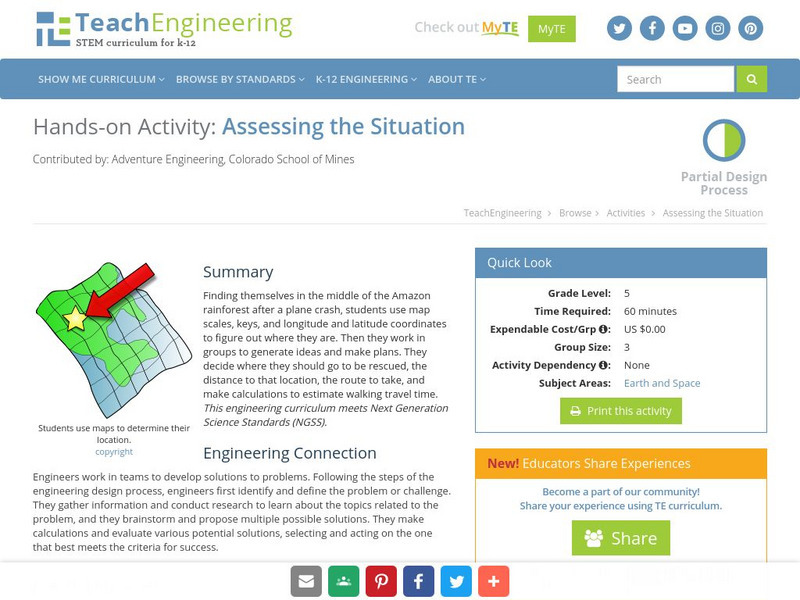
Teach Engineering: Assessing the Situation
In this activity, students will use the scale, the key, and longitude and latitude on a map to determine where they have crashed. They will then use the map scale to determine the distance to the nearest city and how long it will take...
Curated OER
Educational Technology Clearinghouse: Maps Etc: Drawing Asia, 1872
A chart from 1872 illustrating instructions for drawing Asia. "General instructions for drawing the continents. Make a scale by marking on a slip of paper or pasteboard the measures 1,2,3, etc., as on the sides of this map. Every measure...
North Central Regional Educational Laboratory
North Central Regional Educational Laboratory: Graphic Organizers
Explanations and diagrams of nine graphic organizers: spider map, series-of-events chain, continuum scale, compare/contrast matrix, problem/solution outline, network tree, human interaction outline, fishbone map, and cycle.
Georgia Department of Education
Ga Virtual Learning: Geologic Time and Correlation
In this amazing interactive tutorial you will learn about what methods are used by geologists to learn about the history of the Earth. Investigate a geologic time scale and learn about how scientists have developed and organized a record...
E-learning for Kids
E Learning for Kids: Math: Elephant Plant: Data and Graphs
On this interactive website students practice various math skills using a real-life scenario involving plants. Those skills include interpreting data in a circle graph, interpreting data in a divided bar graph, and interpreting a bar...
TeachEngineering
Teach Engineering: Robotic Perimeter
Students learn and practice how to find the perimeter of a polygonal shape. Using a ruler, they measure model rooms made of construction paper walls. They learn about other tools, such as a robot, that can help them take measurements....
Curated OER
Educational Technology Clearinghouse: Maps Etc: Asia (Physical), 1901
A map of Asia from 1901 showing the physical features of the region including mountain systems, plateaus, basins, plains, deserts, lakes, rivers, and coastal features and islands. The map shows major ocean currents, the mean annual...
Scholastic
Scholastic: Hunting for States, Capitals, and National Parks! [Pdf]
Students can use a map of the United States to locate state capitals and national parks.
Science Education Resource Center at Carleton College
Serc: Lab 2: What's a Watershed?
Students build a physical model to simulate watershed features, then use Google Earth software to tie the model to a real place. By exploring several layers of map-based images and data, students learn the complexity of a watershed and...


![Pbs Mathline: Blazing the Trail Lesson Plan [Pdf] Lesson Plan Pbs Mathline: Blazing the Trail Lesson Plan [Pdf] Lesson Plan](https://content.lessonplanet.com/knovation/original/114252-32f99d9ad7a7f3ab46350ac7210f4a68.jpg?1661771099)


![Scholastic: Hunting for States, Capitals, and National Parks! [Pdf] Activity Scholastic: Hunting for States, Capitals, and National Parks! [Pdf] Activity](https://content.lessonplanet.com/knovation/original/480522-367e1f79d58efef695e5c826460eaadd.jpg?1661587497)
