Curated OER
The Disappearing Kelp Forest
Learners observe the effect "El Nino" left on kelp plants and sea urchins. They analyze the data collected by researchers, by graphing it on a TI calculator. Before graphing and analyzing the data, you may want to revisit the events of...
Curated OER
Transformations of Functions 2
Solving problems on the TI graphing calculator can be quite easy. Students observe the properties of transformation of functions and create a formula for the transformation.
Curated OER
Calculator Activity: Add Up and Up
In this adding on, or adding up, worksheet, students use calculators to find the sums of one-digit numbers. Students solve five problems.
Curated OER
Decimal Calculator Numbers
Fourth graders practice working out a hidden number on a calculator by utilizing number sequence in the advanced multiplicative stage seven. They enter a number into their calculator and push the division sign once and go from there.
Curated OER
Calculator Skills
In this math learning exercise, students solve the problems that are related to the use of a calculator. The sheet is intended as a users guide.
Curated OER
Calculating Percents 2
In this calculating percents practice worksheet, students use their problem solving skills to calculate the percents of the 10 listed numbers.
Curated OER
Multiplication Practice: Calculate Cost
In this multiplication worksheet, students use a table to calculate the cost of food items, 7 problems total. Answers included on page 2.
Curated OER
Calculating Perimeter 3
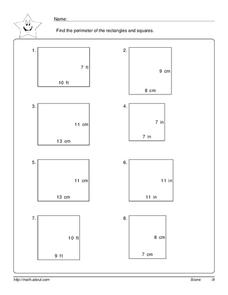
In this calculating perimeter learning exercise, students examine 8 rectangles and use the information provided to find the perimeter of each of them.
Curated OER
Calculating Perimeter
In this calculating perimeter worksheet, learners examine 8 rectangles and use the information provided to find the perimeter of each of them.
Curated OER
Calculate area of Squares and Rectangles
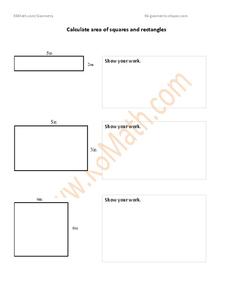
In this geometry skills worksheet, students solve 3 problems that require them to calculate the area of squares and rectangles by using the information provided.
EngageNY
Interpreting the Standard Deviation
Does standard deviation work for non-symmetrical distributions, and what does it mean? Through the use of examples, high schoolers determine the standard deviation of a variety of distributions and interpret its meaning. Problems require...
EngageNY
Changing the Base
I can't calculate a base-2 logarithm since my calculator doesn't have a base-2 log key. Young mathematicians use the change of base formula to extend the properties of logarithms to all bases. Among these bases is the natural log base,...
Teach Engineering
Load It Up!
See how a marshmallow can hold up a bridge load. Teams take a closer look at the design of bridge piers. They determine the types of loads that might affect a bridge, and, using that information, they calculate the needed cross-sectional...
Virginia Department of Education
Sales Tax and Tip
Don't forget to tip your server. Future consumers learn how to calculate sales taxes and tips. Pairs use actual restaurant menus to create an order and determine the total bill, including taxes and tips.
Yummy Math
Parametric Equations and a Heart
Trigonometry, art, and Valentine's Day come together in a creative activity about parametric equations. Learners calculate several equations before graphing them either by hand, on a graphic calculator, or Excel spreadsheet to curve...
EngageNY
Buying a Car
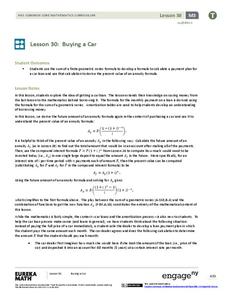
Future car owners use geometric sums to calculate payments for a car loan in the 31st installment of a 35-part module. These same concepts provide the basis for calculating annuity payments.
Virginia Department of Education
Special Right Triangles and Right Triangle Trigonometry
Right triangles are so special! Use special right triangles to discover the trigonometric ratios. Pairs construct special right triangles and find the values of the ratios of the sides. In the process, they discover the ratios stay the...
Virginia Department of Education
Box-and-Whisker Plots
The teacher demonstrates how to use a graphing calculator to create box-and-whisker plots and identify critical points. Small groups then create their own plots and analyze them and finish by comparing different sets of data using box...
EngageNY
Margin of Error When Estimating a Population Mean (part 1)
We know that sample data varies — it's time to quantify that variability! After calculating a sample mean, pupils calculate the margin of error. They repeat the process with a greater number of sample means and compare the results.
EngageNY
Building Logarithmic Tables
Thank goodness we have calculators to compute logarithms. Pupils use calculators to create logarithmic tables to estimate values and use these tables to discover patterns (properties). The second half of the instructional activity has...
CK-12 Foundation
Volume by Disks: The Vase Case
Finding the volume is an integral characteristic of a vase. Using the idea that summing the areas of cross-sectional disks will calculate the volume of a rotational solid, pupils find the volume of a vase. Scholars determine the interval...
Texas Instruments
Vandalism 101
Learners explore logic and use Geometer’s Sketchpad and patterns of logic to solve a puzzle.
Illustrative Mathematics
The Price of Bread
As part of an initiative to strengthen our young adults' financial understanding, this problem explores the cost of bread and minimum wage since the 1930s. Learners are asked to find the percent increase from each year and compare it...
Charleston School District
Volume of Composite Shapes
It's the parts that make the whole. Learners apply volume formulas to composite figures to find the total volume of the figure. Previous lessons in this series taught the methods for finding the volume and/or dimensions of...


