Royal Society of Chemistry
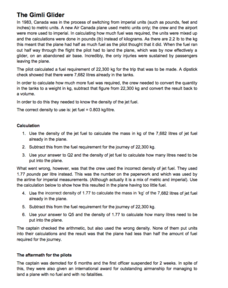
Gimli Glider—Anecdotes for Chemistry Teachers
What's the moral of this story? Units save lives! Teach measurement conversion through storytelling in a quick math-based lesson. Young scientists learn how one country's decision to swap from imperial to metric standard units caused an...
Science Geek
The Mole
What can you call a tooth in a glass of water? A one-molar solution! Presentation covers moles, Avogadro's Number, calculating formula mass, converting moles to grams, converting grams to moles, and calculations with moles. It is...
Howard Hughes Medical Institute
Measuring Biodiversity in Gorongosa
Take your biology class' understanding of biodiversity to a whole new level! Ecology scholars use data to calculate three different diversity indices based on the organisms in the Gorongosa National Park. The four-part activity uses an...
Teach Engineering
Designing Bridges
Introduces your class to the types of loads experienced by a bridge. Groups calculate the ultimate load combinations to determine the maximum load requirement. Using this information, builders then determine the amount of material...
Noyce Foundation
Pizza Crusts
Enough stuffed crust to go around. Pupils calculate the area and perimeter of a variety of pizza shapes, including rectangular and circular. Individuals design rectangular pizzas with a given area to maximize the amount of crust and do...
EngageNY
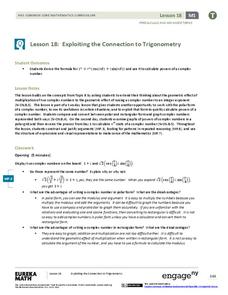
Exploiting the Connection to Trigonometry 1
Class members use the powers of multiplication in the 19th installment of the 32-part unit has individuals to utilize what they know about the multiplication of complex numbers to calculate the integral powers of a complex...
Council for Economic Education
Opportunity Cost
The price of those new shoes involves more than just money! Individuals explore the concept of opportunity cost using a video clip and gratification discussions. They prepare a budget based off of their set of values in regards to...
Illustrative Mathematics
How Many Buttons?
Bring the class into the probability by having everyone count buttons on their shirts. Organize the data into the chart provided and chose different possibilities such as "female with one button" or "all students with more than four...
Natinal Math + Science Initative
Slope Investigation
Context is the key to understanding slope. A real-world application of slope uses a weight loss scenario with a constant rate of change to introduce the concept of slope of a line, before it makes a connection to the ordered pairs...
Exploratorium
Tired Weight
You don't need a scale to determine weight. This activity provides a way to use the concepts of air pressure and surface area to determine the weight of a vehicle by calculating the amount of weight each tire supports.
Yummy Math
How Much Wrapping Paper Can You Save?
Give the ultimate gift this holiday season: Christmas-themed math skills! Young gift givers calculate the amount of wrapping paper that should be used for a particular wrapping method.
Virginia Department of Education
Organizing Topic: Data Analysis
Learners engage in six activities to lead them through the process of conducting a thorough analysis of data. Pupils work with calculating standard deviations and z-scores, finding the area under a normal curve, and sampling...
Virginia Department of Education
z-Scores
Just how far away from the mean is the data point? Pupils calculate the standard deviation for a set of data and find out how many standard deviations a point is away from the mean. The teacher leads a discussion on how to calculate...
National Sailing Hall of Fame
Sailboat Design Requirements
Sailboat design requires more than a half-circle and triangle sketch. After viewing a slideshow presentation that outlines the requirements for sailboat design, learners draw a design, perform the needed...
Teach Engineering
Tools and Equipment (Part 1)
Looking for the best inclined plane for the job? Groups calculate the theoretical mechanical advantage for four different inclined planes. They determine the actual mechanical advantage by measuring the amount of force needed for the...
Rochester Institue of Technology
Meal Picking
Scholars explore systems design and its relation to meal picking by using computer simulations to test systems designs. They learn about the Pick-to-Light System and calculate average picking times.
Teach Engineering
Mechanics of Elastic Solids
Make the connection between Hooke's law and elasticity with an activity that introduces the class to the behavior of elastic materials. The resource defines stress and strain to calculate the modules of elasticity of...
California Education Partners
Miguel's Milkshakes
Moooove over, there's a better deal over there! The fourth segment in a series of eight requires individuals to determine the best unit cost for milk. Scholars calculate the least amount they can spend on a particular quantity of...
Royal Society of Chemistry
pH 4: Activity
Sometimes playing games in class isn't a bad thing. Science sleuths evaluate and calculate pH and pOH with an online resource. They then manipulate concentration information and relate it during a series of puzzles.
PBS
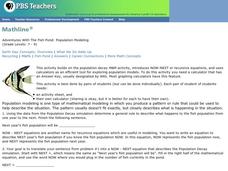
Adventures With The Fish Pond: Population Modeling
Build up from the previous activity where your learners charted the population growth and decay of a fish pond with M&Ms®. Have them look at the data from that activity and create a Now-Next, or recursive equations, to predict the...
Curated OER
Exponential Growth versus Linear Growth II
Your algebra learners discover that exponential functions, with a base larger than one, outgrow linear functions when the inputs increase sufficiently. Their analysis includes using a graphing calculator to produce tables.
Santa Barbara City College
How to Make a Multiplication Table
Teach children how to make a multiplication table, and they'll be multiplying for life. Following this series of steps, young mathematicians learn to use patterns and the relationships between numbers to create...
EngageNY
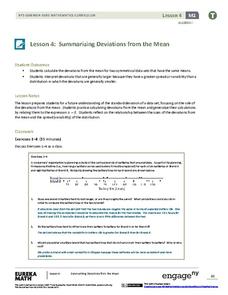
Summarizing Deviations from the Mean
Through a series of problems, learners determine the variability of a data set by looking at the deviations from the mean. Estimating means of larger data sets presented in histograms and providing a way to calculate an...
Noyce Foundation
Mixing Paints
Let's paint the town equal parts yellow and violet, or simply brown. Pupils calculate the amount of blue and red paint needed to make six quarts of brown paint. Individuals then explain how they determined the percentage of the brown...


