Curated OER
Calculating Parts per Million: Do We Have a Problem Here?
Students calculate ppm and ppb by using unit analysis when given a ratio of amounts.
They determine in ppm what constitutes a health risk for a particular toxin given data
and whether local health officials should close a lake...
Curated OER
Lab: Determining the Number of Moles and Molecules Used Up In a Burning Candle
Students find moles and molecules used when a candle burns. In this moles and molecules lesson plan, students calculate the initial mass of a candle and the mass of a candle after it burns for 3 minutes. They calculate the mass lost when...
Curated OER
Math of the Path: Students Calculate Data from the Lewis and Clark Journey
Students use calculations to complete the same journey of Lewis and Clark. They answer questions along their way and share information they gather with the class. They compare their calculations with those made by Lewis and Clark.
Curated OER
Designing Models to Simulate Actual Events Using a Random Number Generator
Students design models to simulate actual events using a random number generator on a calculator. They estimate the likelihood of a particular outcome using results of simulations. Answer Key included.
Curated OER
Calculating Total Radiation Dosages at Mars
In this Mars radiation worksheet, students use data from the Mars Radiation Environment Experiment to solve 4 problems. They determine the total radiation dosage during a specific period of time, they determine the dosage during the...
Curated OER
Cost Calculations Lesson Plan
Students analyze data using graphs and equations. In this algebra activity, students calculate the cost of lumber, convert price per foot to price per piece, solve equations using addition and subtraction and give exact answer when...
Curated OER
Calculating Wave Speed
In this wave speed worksheet, students will learn how to calculate the speed of waves by dividing the wavelength by the period. Students will then calculate wave speed for 7 different examples.
Curated OER
Graphing Calculator Activity
In this graphing calculator worksheet, students explore the steps to analyze a complex fraction using a graphing calculator. They simplify a complex fraction to a proper fraction. This four page worksheet contains detailed instructions...
Curated OER
The Demographics of Immigration: Using United States Census Data
High schoolers work together to analyze United States Census data on immigration. They compare and contrast the data and determine how immigration numbers have changed over time. They calculate percentages and make their own...
Texas Instruments
Making Predictions Using Systems of Equations
Students explore the concept of systems of equations. In this system of equations instructional activity, students enter data into lists on their calculators about 100 meter dash times. Students plot the points using a scatter plot and...
Curated OER
Exam Review: Chemistry Calculations
In this chemistry calculations review worksheet, students solve 33 review problems about titrations, precipitates, pressure and volume of gases, combustion reactions, heat of combustion, molar concentrations and molecular formulas.
Curated OER
Using a Spreadsheet to Understand Density
Students use density to identify what metal a gold colored weight is made of. They use a spreadsheet to graph the experimental density of common metals and compare the know densities to their calculated density of the known metal.
Curated OER
Classifying Triangles by the Length of the Sides Using Cabri Jr.
Learners follow detailed directions to create triangles on their graphing calculator. In this properties of triangles lesson plan, they will create triangles on their calculators using the Cabri Jr. application. They then identify three...
Curated OER
Calculation the Cricumference of Earth using "Google Earth"
Eighth graders investigate properties of circles. In this eight grade mathematics activity, 8th graders apply proportional reasoning to data gathered with “Google Earth” to calculate equatorial and polar circumference of the...
Curated OER
Making Predictions from Data with a Graphing Calculator
For this making predictions from data worksheet, students solve 15 short answer problems. Students determine average miles per gallon given data on miles traveled and gas used. Students make predictions using the data and a line of best...
Curated OER
Chemical Calculations
For this elements worksheet, students use the relative atomic masses of given elements to calculate the relative formula mass. Students calculate the mass of compounds from given number of moles and determine the number of moles from a...
Curated OER
Making Informed Decisions Using Measures of Central Tendency
Students calculate the mean, median, mode, range, and interquartile range for a set of data. They create a box and whisker plot using paper and pencil and technology and determine which measure of central tendency is the most helpful in...
Curated OER
WS 1.9 Review-Calculations
In this calculations review learning exercise, students convert from one metric unit to another, they identify significant figures in numbers, they find density of substances, and they solve problems using dimensional analysis.
Curated OER
Using Density to Identify Metals
Students learn how to measure the density of metals. For this density of metals lesson plan, students measure the density of various metals in order to determine what metals were substituted in a king's crown, scepter, breast plate and...
Curated OER
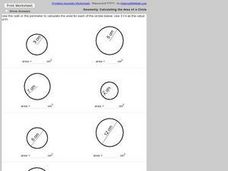
Geometry: Calculating the Area of a Circle
In this area worksheet, learners use the perimeter or radius to determine the area of a circle. This one-page worksheet contains 8 problems. This worksheet may be produced in printed form. Answers may be viewed on-line.
Curated OER
Using Cabri Geometry to Create Fractals
Learners construct the Sierpinski Triangle using Cabri Jr. They use a step-by-step guide to construct the Sierpinski Triangle on their graphing calculator and then discuss the formula for constructing a nth stage Sierpinski Triangle.
Curated OER
Geometry of Triangles Using a Protractor
Seventh graders use a protractor to measure angles and solve a problem involving distance. In this measuring angles with a protractor lesson plan, 7th graders calculate the distance of a line on a diagram by using a protractor to measure...
Curated OER
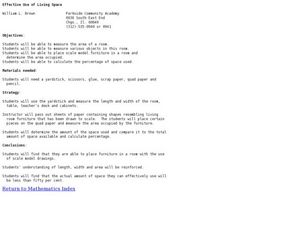
Effective Use of Living Space
Students explore the concept of scale. In this scale lesson, students create a scale model of a room. Students calculate the area of a room. Students determine what percentage of the room is occupied by furniture.
Curated OER
Using Tables to Solve Linear Functions
Oh that intercept! Budding algebra masters solve linear equations from standard to intercept form. They identify the slope and y-intercept to help graph the lines, an then create coordinate pairs using a table of values. Great TI tips...
Other popular searches
- Division Using a Calculator
- Math Using a Calculator
- Money Using a Calculator
- Graphing Using a Calculator
- Exponents Using Calculators
- Math Using Calculators
- Using a Calculator/an
- Practice Using Calculators


