Curated OER
America the Beautiful
Learners listen to a read-aloud discussing the landmarks of the United States. In pairs, they use the internet to research a landmark of their choice. They create a visual aid to be given with a presentation sharing the information...
Curated OER
Stream Gages and GIS
students interpret recent regional-scale climate events based on current stream flow, monitor changes in time, and to consider additional interpretations that could be derived if other data were in map form.
Curated OER
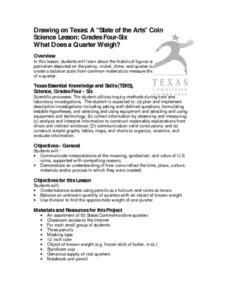
What Does a Quarter Weigh?
Students study the historical figures and symbols of U.S.
patriotism depicted on the penny, nickel, dime, and quarter coins. They
create a balance scale from common materials to measure the approximate weight
of a quarter.
Curated OER
Possible Causes
Young scholars review any materials from two previous lessons on emissions. As a class, they use a graphic organizer to review their stakeholder's hypothesis. They identify possible causes of global warming and discover how to solve this...
Curated OER
Snow Cover By Latitude
Learners examine computerized data maps in order to create graphs of the amount of snowfall found at certain latitudes by date. Then they compare the graphs and the data they represent. Students present an analysis of the graphs.
Curated OER
Exploring Infrared Image Technology
Students view infrared images of a blowing hair dryer, a Popsicle, and a toaster. They discuss the images and ways they are different than visible light images. Students view a temperature scale and discuss which parts of the item are...
Curated OER
Geography: Islands and Alcatraz
Students, in groups, create maps of islands including map keys and compass roses. They compare and contrast their island communities with that of the island prison, Alcatraz. Students select from a series of projects, including writing...
Curated OER
Architectural Buildings
Fifth graders explore various styles of architecture. They work together to create a town with clay buildings that come together in order to form this small town. They discuss maps, layouts, and the structure of buildings.
Curated OER
Sea Surface Temperature Trends of the Gulf Stream
Students explore the importance of the Gulf Stream. Using a NASA satellite images, they examine the sea surface temperature. Students collect the temperature at various locations and times. Using spreadsheet technology, they graph the...
Curated OER
Deer Tracks
Young scholars use satellite images to track to movement patterns of deer and examine deer behavior. They write stories about a day in the life of a field scientist.
Curated OER
Sea Surface Temperature Trends of the Gulf Stream
Young scholars use authentic satellite data to produce plots and graphs of sea surface temperature as they explore the seasonal changes of the Gulf Stream.
Curated OER
Burt County, NE, Soil Survey
Students identify the soil types and textures, and locate the waterways in or near the towns of Lyons and Decatur, Nebraska. They analyze soil profile maps, and answer conclusion questions.
Curated OER
Route Reconstruction
Learners trace sailing route of Spanish and Portuguese exploration ships. They calculate and compare distances that different explorers traveled. Students calculate how long it would take to travel an explorer's route using different...
Curated OER
Site vs. Situation: Location! Location! Location!
Students examine places with a similar latitude to Alabama, and discuss the importance of a location's site versus its situation. They analyze maps, create a chart, and write a paragraph on the difference between site and situation.
Curated OER
Peru's Earthquake
Students identify the patterns of earthquakes by mapping USGS data and comparing it to mapped tectonic plates. They discover the relationship between earthquakes and the moving plates of the Earth's crust.
Curated OER
Ecosystems
Students work together to identify the characteristics of their local ecosystem and another one nearby. In groups, they use a Venn Diagram to compare and contrast the two. They use this information to create a collage of both...
Curated OER
Houses
Third graders use a number of problem solving strategies in this unit of lessons. They determine how to draw and model three-dimensional objects, use co-ordinate systems, determine probability of events, and identify paths of simple...
Curated OER
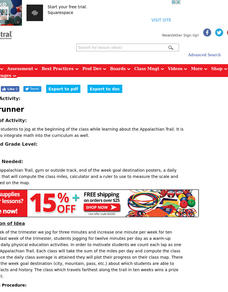
Ridgerunner
Students jog for three minutes at the beginning of the class, increasing one minute per week for ten weeks. They count each lap as one mile on the Appalachian Trail, computing the class average and plotting their progress on a class map.
Curated OER
Earthquakes and Seismic Waves
Students investigate the Richter scale and seismology in a teacher-led lab in which they are introduced to the concept of seismic waves and epicenter location. They further investigate the inner workings of a seismograph and practice...
Curated OER
Patchwork of the Planet
Young scholars are taught how satellite images can be joined to make a picture mosaic. They use actual satellite images to make satellite mosaics regions of the United States. Students use a camera to photograph portions of a globe in...
Curated OER
The Slave Trade
Students map and explore a possible slave trade route. In this slave trade mapping lesson, students calculate the distance and amount of time it would take for African slaves to arrive in America.
Curated OER
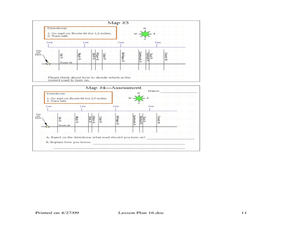
Where Should You Turn?
Fourth graders complete activities to study decimal numbers. In this decimal numbers lesson, 4th graders study decimal numbers to express numbers less than one and intervals. Students complete map and location activities to study the...
Curated OER
Activities to Enhance STEDII Data
Students develop an understanding of related weather processes such as wind, cloud cover, and temperature using STEDII data and instrumentation. In addition, they integrate mathematical calculations to produce a forecast map.
Curated OER
Regional Economics in the United States
Students describe and provide examples of the primary factors
behind the regional pattern of economic activity in the United States. They create maps showing regional economics patterns
in the US and examine those patterns in comparison...
Other popular searches
- Using Map Scale Distance
- Proportions Using Map Scale
- Using Scale on Maps
- Maps Using Scale
- Using a Scale Map


