Curated OER
Mapping a Stream
Students map an actual local waterway. They create full color scale drawings that include windfalls, plant cover, streambed composition, and landmarks such as trees, boulders, and slumps. This is a long-term project that involves...
Curated OER
Media Center Map Skills
Student demonstrates the ability to locate, retrieve, and handle media and equipment by utilizing the library media center floor plan, symbols, and guides. They then use systems of classification to identify, locate, and retrieve materials.
Curated OER
Tactile Maps
Students make a map of an assigned area (state, country, etc.) using a 3-D pictorial-tactile representation of the features to be included. They also learn to create a pictorial- tactile representation of their knowledge of a region, and...
Chicago Botanic Garden
Historical Climate Cycles
What better way to make predictions about future weather and climate patterns than with actual climate data from the past? Young climatologists analyze data from 400,000 to 10,000 years ago to determine if climate has changed over time....
Curated OER
Measurement 3: Rulers
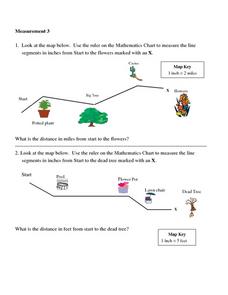
In this measurement worksheet, pupils measure the linear distance, in inches, between stated objects. Next, they determine the actual distance, in miles.
Foundation for Water & Energy Education
What is the Water Cycle? Activity A
Hydrologists create a concept map about how water is used and a sentence strip defining water and describing its unique properties. Small groups work together to fill a small milk carton and compute the mass of water inside. The next...
Curated OER
Scale Basketball
High schoolers understand that a spreadsheet can be used to find the best scale to use in a model. They place the distances of the planets of the solar system to the Sun in one column of the spreadsheet. Students try different scales so...
Curated OER
MAP UNIT
First graders investigate how maps are used to identify different locations. They will also appreciate how there are different types of maps for their purposes. Finally students study how maps contain symbols that represent real places.
Curated OER
Grid it, Map it
Students participate in designing a city layout using grids and coordinates. They work on a city space and create a grid on a life size layout on the gym floor.
Curated OER
Water Contamination Mapping Lab
Students are introduced briefly to the Biscayne Bay Ecosystem, observed microbe distributions and water current maps are introduced. They measure water current speeds to predict the movement of pollutants based on the type of the tidal...
Curated OER
The Grand Excursion GPS Map
Eighth graders investigate the uses of a global positioning system. They create waypoints and have to find them using the system. Students must review the geographical concepts of latitude and longitude. The media requirements of the...
Curated OER
Coordinate Grid: Mapping Archeological Sites
Fourth graders discover how to apply the Cartesian coordinate system by figuring out the length and width of their school playground. They determine that pacing is an important tool for the initial mapping of a site. Students conduct a...
Curated OER
Geography - Mapping the Holocaust
Eighth graders map the important locations of the Holocaust. For this Holocaust lesson, 8th graders research the location of countries involved in the Holocaust as well as the location of concentration camps. Students mark the locations...
Curated OER
Mapping Potato Island
Students create their own topographical map using a potato. In this hands on lesson plan students construct a topographical map and explain what contour lines are using a potato.
Curated OER
Motion of the Sun and Earth: Using a Playground Model to Explore Rotation and Revolution
Pupils experience the rotation of the Earth and the Sun and the Earth's revolution around the Sun, using a playground mode.
Curated OER
Using Radiosonde Data From a Weather Balloon Launch
Student use radiosonde data from a weather balloon launch to distinguish the characteristics of the lower atmosphere. They learn the layers of the atmosphere. They graph real atmospheric data.
Curated OER
Current Events, Geography
Students read the newspaper to become aware of what is happening in their city, state, nation, and world. They summarize, find locations on a map and ask thought-provoking questions.
Curated OER
Quick-Sketch Artist Tips on Mind Mapping the Urban Landscape
Students interpret maps. They also create mental maps of regions in which they are studying. Students then explain the historical or cultural significance of map features orally or in written form. Students take a walking field trip...
Curated OER
Mud Maps
Students discuss the location of stores, buildings, and homes in their community. Afterwards, they create a 'mud map' demonstrating the route from one point to another. In pairs, students read travel directions from a brochure, while...
Curated OER
Making Personal Maps
Students study maps and become familiar with how to use one. In this investigative instructional activity students create a map of an area and provide a legend.
Curated OER
Making a Map of the Classroom
Young scholars create a map of the classroom using the computer programs AppleWorks and iChat in this math-based technology lesson plan. Lesson extension ideas include a scavenger hunt and maps of other school buildings.
EngageNY
Properties of Dilations
Investigate dilations to learn more about them. The second segment in a series of 16 provides a discussion of properties of dilations by going through examples. The problem set provides opportunities for scholars to construct dilations.
Mathematics Assessment Project
Linear Graphs
A line is a line is a line. As a middle school assessment task, learners first identify graphs of given linear equations. They then identify the equations that represent real-world situations.
Other popular searches
- Using a Map Scale
- Using Map Scales
- Using Map Scale Distance
- Using Maps to Scale
- Proportions Using Map Scale
- Maps Using Scale


