Curated OER
Number Pairs
As you introduce graphs and coordinate pairs, use this guided activity to get scholars started. They reference an example before recording number pairs to identify the location of 12 letters on a grid. Next, learners examine shapes on a...
Curated OER
Speed
Fifth and sixth graders practice working in pairs to determine whether they can walk with constant speed. They test themselves, collect their data, draw graphs with their data collected, manipulate the data, and then draw conclusions...
Curated OER
Stars and Slopes
More of a math lesson than physics or space science, high schoolers take a set of data and plot it on a log-log coordinate system. The write-up for day two was never completed, but day one, "Stars and Slopes," is complex and cohesive....
Ed Migliore
Linear Equations in Two Variables
This traditional textbook style unit includes vocabulary, a direct explanation section, examples, practice problems that directly line up with the explanations and examples, and a unit summary review and practice problems. Learners get...
Texas Instruments
Complex Numbers: Plotting and Polar Form
Explore the concept of, and use the Ti-Nspire to, convert complex numbers into polar form. Then practice graphing complex numbers in the polar coordinate plane.
Curated OER
Graphing Systems of Inequalities
Solve equations and graph systems of inequalities. Designed as a lesson to reinforce these concepts, learners revisit shading and boundaries along with solving linear inequalities.
Curated OER
Location on a Grid
There are 12 symbols on this large grid, and scholars must record a location for each. They use the coordinate pair system which is made easier because every symbol is directly inside a square. Use this to introduce coordinate pair...
Curated OER
Walk-A-Thon
Students graph linear http://www.lessonplanet.com/review?id=180542equations. For this problem solving lesson, students calculate slope and plot ordered pairs on a coordinate grid. Using a real-life example of a walk-a-thon, students...
Curated OER
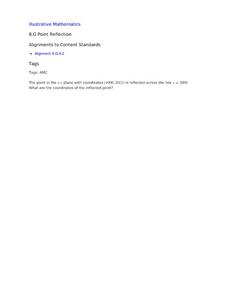
Point Reflection
Use this task as an exit ticket for your eight graders during the geometry unit. All they need to do is identify the coordinates of a point reflected over y=2000.
Curated OER
Systems of Equations and Inequalities
This is a comprehensive lesson on creating and solving equations and systems of equations and inequalities. Problems range from basic linear equations to more complex systems of equations and inequalities based on a real-world examples....
Curated OER
Graphing Inequalities in Two Variables
This study guide is a great resource to help you present the steps to graphing linear inequalities. Show your class two different ways to graph an inequality and work on a real-world example together. The document could also be easily...
Illustrative Mathematics
Chocolate Bar Sales
In this real-world example, algebra learners start to get a sense of how to represent the relationship between two variables in different ways. They start by looking at a partial table of values that define a linear relationship. They...
Curated OER
Barbie Bungee
Middle and high schoolers collect and analyze their data. In this statistics lesson, pupils analyze graphs for linear regression as they discuss the relationship of the function to the number of rubber bands and the distance of the...
Google
Midpoint and Distance Foldable
Support young mathematicians with learning the concepts of midpoint and distance with this foldable resource. Offering both graphic examples and written equations, this reference clearly demonstrates for students how these key terms...
Curated OER
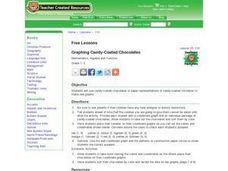
Graphing Candy-Coated Chocolates
Learners place pieces of candy on their coordinate graphs as the teacher calls out the colors and coordinates embedded in the plan. The teacher circulates around the class to check each student's answers for accuracy.
Curated OER
Writing Equations of Parabolas in Vertex Form
Pupils use their knowledge of the vertex form of a quadratic equation to graph parabolas using a graphing calculator, given a specific move to make. this lesson may be used as a review or as extra practice, in groups or individually.
Curated OER
A Real Life Example of the Distance Formula
Students answer the following question: "Using the lines of latitude and longitude, what is the distance (in degrees) if you were to travel from NASA Dryden to NASA Ames?" They use the distance formula to find the distance (measured in...
Curated OER
Data Collection and Graphing
Students collect data and graph it on a coordinate plane and analyze it. In this statistics lesson, students display their data collection using a graph. They determine which central tendency will work best.
National Humanities Center
Teaching The Great Gatsby: A Common Core Close Reading Seminar
The 41 slides in a professional development seminar model how to use close reading techniques to examine the many layers of F. Scott Fitzgerald's The Great Gatsby. In addition to passages from the novel, slides provide biographical...
Curated OER
Pre-Calculus Review Sheet
Pre-Calculus has some detailed formulas involved and here is a great resource that lumps then all together for you. Broken up into rectangular, polar, and parametric sections, the conics all include formulas and graphs.
College Board
2007 AP® Calculus BC Free-Response Questions
Provide a review for the exam so individuals don't tank. AP® provides the free-response questions for teachers to use to help their pupils prepare for the exam. The six BC questions from 2007 include regions bounded by functions, water...
Curated OER
Graphing Integers
Fifth graders complete an integer graphing activity. In this integer graphing lesson, 5th graders use coordinate grids to help them complete linear functions and integer graphing.
Virginia Department of Education
Transformations
The coordinate plane is a popular place! Identify rotations, reflections, and dilations on the coordinate plane. Pupils work in small groups to match transformations of a figure with the description of the transformation. They perform...
Curated OER
Compound Inequalities and Graphing
Put geometry skills to the test! Learners solve compound inequalities and then graph the inequalities on a coordinate plane using their geometric skills. They identify the slope and y-intercept in order to graph correctly. I like this...


