Curated OER
Rational Function Graphs
Young scholars use algebraic methods to represent and solve problems. Using a graphing calculator, students solve rational and inequality problems. They visually demonstrate solutions of functions through graphing. Young scholars...
Curated OER
Graphing Ordered Pairs
Seventh graders investigate the concept of ordered pairs as found in Algebra. They are introduced to the data set that corresponds to the coordinate system. Also students practice the graphing the ordered pairs using the x and y axis.
Curated OER
Graphs of Quadratic Functions Section 11.6
In this graphing worksheet, students graph quadratic functions. They identify the maximum and minimum value of the function, determine the line of symmetry, and locate the vertex. Coordinate planes are provided for each function. There...
Curated OER
Graphs of Quadratic Equations
For this math worksheet, students solve the problems that ask for the graph of the parabola. They interpret the quadratic equation for its solutions.
Curated OER
VARIABLES AND PATTERNS, USE AFTER INVESTIGATION THREE. DISCRETE OR CONTINUOUS LINEAR RELATIONS.
Students discover for which kind of linear function is appropriate to use the "scatter" or the "connected" term. In this instructional activity, students investigate functions using variables, patterns book, graph paper, rulers and the...
Curated OER
Generating Points and Graphing
Students create a table of values to help them plot. In this algebra lesson, students plot their points on a coordinate plane creating a graph. They observe and analyze linear functions.
Curated OER
Graphs
In this graph template worksheet, young scholars use the ten by ten coordinate grid to solve problems. Students observe 1 graph.
Curated OER
Location, Location, Location: Using a Grid to Determine Context
Seventh graders are introduced to making inferences about artifacts. Using a grid system, they locate the artifacts and determine where they originated from. They use this information to make conclusions about the way people lived...
Virginia Department of Education
What's the Point?
Point your class in the right direction in plotting points with three activities that give scholars a chance to learn about and practice plotting points on a coordinate plane. They draw figures on the coordinate plane and list out the...
EngageNY
Linear Equations in Two Variables
Create tables of solutions of linear equations. A lesson has pupils determine solutions for two-variable equations using tables. The class members graph the points on a coordinate graph.
EngageNY
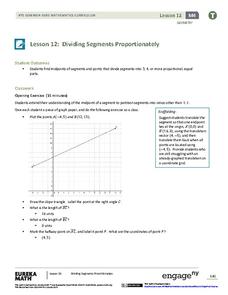
Dividing Segments Proportionately
Fractions, ratios, and proportions: what do they have to do with segments? Scholars discover the midpoint formula through coordinate geometry. Next, they expand on the formula to apply it to dividing the segment into different...
EngageNY
Perimeter and Area of Polygonal Regions Defined by Systems of Inequalities
When algebra and geometry get together, good things happen! Given a system of inequalities that create a quadrilateral, learners graph and find vertices. They then use the vertices and Green's Theorem to find the area and perimeter of...
EngageNY
Similarity
Use the coordinate plane to show two figures are similar. The lesson plan incorporates congruence transformations and dilations to move a figure on to another figure. Pupils determine that if a similarity transformation...
EngageNY
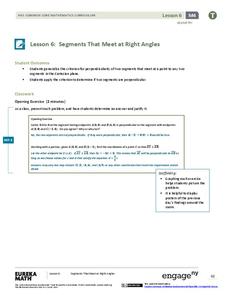
Segments That Meet at Right Angles
Can segments be considered perpendicular if they don't intersect? Learners look at nonintersecting segments on the coordinate plane and make conclusions about the lines that contain those segments. They determine if they are...
California Mathematics Project
Reflections
Reflections are the geometric mirror. Pupils explore this concept as they discover the properties of reflections. They focus on the coordinates of the reflections and look for patterns. This is the third lesson in a seven-part series.
EngageNY
The Computation of the Slope of a Non-Vertical Line
Determine the slope when the unit rate is difficult to see. The 17th part of a 33-part series presents a situation that calls for a method to calculate the slope for any two points. It provides examples when the slope is hard to...
Pennsylvania Department of Education
Using the Coordinate Plane in Problem Solving
Fifth graders practice solving problems. In this fraction and decimal lesson, 5th graders recognize the relationship between fraction and decimals. Students estimate problem results and write expressions to use for problem...
Curated OER
Quadrilaterals in the Coordinate Plane
Students find the coordinates of the vertices of special quadrilaterals placed in the coordinate plane. They find the coordinates of missing vertices of squares and parallelograms.
Curated OER
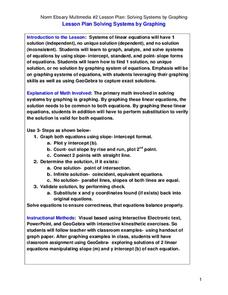
Solving Systems by Graphing
Students solve systems of equation through graphing. In this algebra lesson, students solve linear equations and analyze the result to figure out if there is one solution, no solution or infinitely many solutions. They graph their lines...
Curated OER
Ordered Pairs on a Coordinate Plane
Seventh graders identify the quadrants and axis of a coordinate plane. In this algebra lesson, 7th graders discover the correct way to graph using the coordinate plane. They discuss the relationship between x and y values, domain and...
Curated OER
Solving Using Linear Equations
Seventh graders explore linear equations. They observe the relationship between linear equations an patterns. Students make decisions using information given in graphs to solve linear equations. They perform a toothpick activity to...
Texas Instruments
Graphing Calculator Investigation Graphs of Relations
Learners investigate relations in this algebra lesson. They graph the set of ordered pairs that determine a relation. Using a TI-83 Plus, your learners will enter the coordinates in a list, create a scatter plot, and manipulate the...
Curated OER
Using Vegetation, Precipitation, and Surface Temperature to Study Climate Zones
Middle schoolers begin their examination of the climate zones found around the world. Using a software program, they identify the relationship between the vegetation, climate and temperatures of the different zones. They also plot...
Curated OER
Using Tables to Solve Linear Functions
Oh that intercept! Budding algebra masters solve linear equations from standard to intercept form. They identify the slope and y-intercept to help graph the lines, an then create coordinate pairs using a table of values. Great TI tips...


