Virginia Department of Education
Dilation
Open up your pupils' eyes and minds on dilations. Scholars perform dilations on a trapezoid on the coordinate plane. They compare the image to the preimage and develop generalizations about dilations.
Curated OER
The Way to Better Grades!
Pupils collect and analyze data. In this statistics lesson, learners create a scatter plot from their collected data. They use, tables and graphs to analyze the data and mae decisions.
Georgia Department of Education
The Basketball Star
Have learners use math to prove they are sports stars! Assess a pupil's ability to create and analyze data using a variety of graphs. The class will be motivated by the association of math and basketball data.
Curated OER
Equations from Unit Rates
Your class can become linear equations masters, as they calculate the rate of change of a function. They observe different types of coordinates as they relate to a graph, then use the Ti-navigator to move the line around and draw...
Curated OER
Data
Students collect data from an experiment they perform. In this data lesson, students use multiple representations to solve practical problems; describe advantages and disadvantages of the use of each representation. Then, they evaluate...
Curated OER
Grab the Candy Hearts
For this candy activity, learners play the game Grab the Candy for Valentine's Day where they roll dice to find ordered pairs on a graph and place the candy inside that square. Students play until all candy is gone and use the scoring...
Curated OER
Gridlock Jr.
In this gridlock worksheet, students roll dice and put counters in the ordered pairs on the graph that they get from the rolled dice. Students play this game and whoever gets 3 in a row wins.
101 Questions
The Mystery Line
Take the mystery out of linear functions. Provided an image with no scale, learners guess where the line that connects them might cross the y-axis. After providing the coordinates of the points, they realize scale is an important...
Corbett Maths
Average Rate of Change
Simply find the slope to find the average rate of change. A short video provides the definition of the average rate of change. Using the definition, pupils calculate the average rate of change to solve problems that cover finding average...
Curated OER
What a Site!
Fourth graders are introduced to how to properly create a grid site. In groups, they use Cartesian coordinates to establish the boundaries for the grid and photograph the location of artifacts. They exchange their photos with another...
Curated OER
Graphing Review
Students review the principles of graphing linear functions. They discuss plotting points on a coordinate plane, solving using a table, and then graphing. Students solve problems and determine the slope of the line, y-intercept and if...
Curated OER
Geometric Transformations
Students solve problems involving transformations of geometric figures. They review graphing points in the coordinate plain, plot points and connect to create a triangle. Then, they reflect triangles over the x and y axis and use...
Curated OER
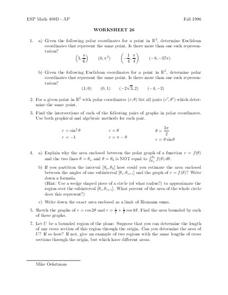
Worksheet 26
In this math activity, students use the polar coordinates to find the Euclidian coordinates. Then they compare points on the coordinate plane.
Curated OER
Hands On: Linear Equations
In this linear equation worksheet, 5th graders complete the equations, and fill in the function tables, before graphing the equation on the coordinate planes in 4 problems . They use equations with variables to solve 2 problems.
Curated OER
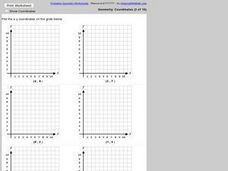
Plotting Coordinates on a Grid
In this plotting points on a graph worksheet, students plot 6 points on 6 graphs. Students plot x and y-coordinates in the first quadrant.
Curated OER
The Coordinate Plane
Fifth graders use the attached worksheet, Where's My Location? - Directions, to play a game in which they plot points on a grid.
Curated OER
Handy Reflections
Learners explore reflections on a coordinate plane in this lesson. They trace their hand on a grid, determine the coordinates of each point, and create a scatter plot of their points. Pupils use this information to investigate aspect...
Curated OER
Flips, Turns, and Slides: Adventures with Transformations
Students explore transformations. In this math lesson, students plot points on a coordinate grid and construct shapes. Students discuss movements on the grid as flips, turns and slides.
Curated OER
Let's Go Slopey
Students create a table of values to graph a line. In this algebra instructional activity, students identify the slope and intercept of a linear equation. They use a Ticalculator to graph their function.
Curated OER
Transforming Triangles
Sixth graders examine how to graph translations (slides) and reflections (flips) on a coordinate plane. They practice the slides and flips kinesthetically and apply it to a worksheet working with triangles.
Curated OER
It's a Drag!
Students create number lines using decimals and whole numbers. In this algebra lesson, students graph and solve linear equations. They plot ordered pairs on a coordinate plane correctly.
Curated OER
Fossil Fuels and Its Effects On The World
Students explore the effects of a declining fossil fuel system would have on the world. They read the line graph and other information to answer questions about fossil fuels. Students use mathematics to analyze graphical data and...
Curated OER
Creating Line Graphs
Learners draw line graphs. For this math lesson, students interpret minimum wage data and graph the data in a line graph. Learners predict the next minimum wage and figure the earnings for a 40 hour work week for someone earning the...
Curated OER
Make a Design by Plotting Points
Students plot points on graph paper to make designs. They color their designs.


