Curated OER
Coordinate Graphs, Translations and Reflections
Young scholars perform translations and reflections. In this algebra lesson, students use the TI calculator to graph functions. They move the functions around on the coordinate plane using translation and reflection.
Curated OER
Graphing and Interpreting Linear Equations in Two Variables
Graph linear equations using a table of values. Learners solve equations in two variables using standard form of an equation. They identify the relationship between x and y values.
Curated OER
Algebra: Coordinates and Straight Line Graphs
Young mathematicians review what they have previously learned about coordinates and straight line graphs. Then, they access an interactive component within the lesson to gain more practice with this skill. Additionally, there are two...
Curated OER
Graphing Ordered Pairs On A Coordinate Plane
Sinking ships, construction paper, coordinate planes, sounds like fun day in math class. Play the game Battleship with your class and reinforce the concept of graphing ordered pairs.
Curated OER
Graphing Greenery
Students gather leaves and trace them on graph paper. They plot coordinates that approximate the shape of the leaves and share those coordinates as "worksheets" for other students to complete.
Curated OER
Identify and Graph Linear Equations
Students investigate linear functions. In this mathematics activity, students plot points onto a graph by solving the equations y=x and y=mx+b by being given numbers for x and solving for y.
Curated OER
Connecting With Coordinates
Play a coordinates game to encourage collaborative learning and grid use! Learners plot points on grids and play a game that challenges them to locate a specific point on a coordinate grid by using horizontal and vertical movements.
Curated OER
Graphs and Functions
Use this series of activities to introduce learners to graphing functions. They graph both linear and quadratic equations by hand and with a Graph Sketcher Tool. Several imbedded links and handouts are included in the lesson.
Curated OER
Introduction to Graphing
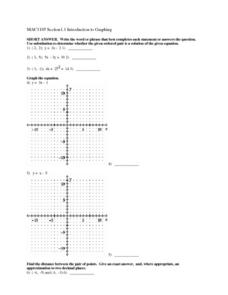
In this graphing worksheet, young scholars graph linear equations on a coordinate plane. Students identify the slope and y-intercept of each problem, find the midpoint of a line, and the distance between given points. Given an equation,...
Curated OER
Coordinates on a Shower Curtain: Math
Students use a shower curtain to represent a coordinate plane and then physically demonstrate their understanding or ordered pairs as they move from place to place.
Curated OER
Transforming Snoopy Using Coordinates
Students graph coordinate points to create a picture of Snoopy. In this coordinate point lesson, students read a book and learn about Rene Descartes' invention, the coordinate grid. Students graph a surprise picture on...
EngageNY
Structure in Graphs of Polynomial Functions
Don't allow those polynomial functions to misbehave! Understand the end behavior of a polynomial function based on the degree and leading coefficient. Learners examine the patterns of even and odd degree polynomials and apply them to...
Curated OER
Exploring Transformations with Matrices
A page right out of the Holt Geometry book. Use a graphing calculator and graph paper to explore transformations with matrices.
Curated OER
MP3 Purchase Plans
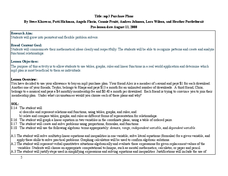
Use algebra to solve real world problems. Mathematicians practice use of graphs, tables, and linear functions to solve a problem regarding mp3 purchase plans. They work in groups to solve the problem and present their findings and...
Virginia Department of Education
Circles in the Coordinate Plane
Make the connection between the distance formula and the equation of a circle. The teacher presents a lesson on how to use the distance formula to derive the equation of the circle. Pupils transform circles on the coordinate plane and...
Virginia Department of Education
Graphing Systems of Inequalities
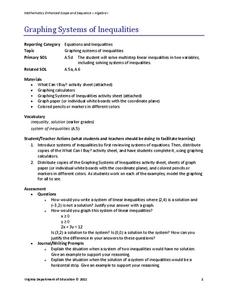
Apply systems of inequalities to a real-world problem. Here, scholars learn to graph solutions to systems of linear inequalities. To finish the lesson, they solve a problem involving burgers and cheeseburgers using a system of inequalities.
EngageNY
Some Facts About Graphs of Linear Equations in Two Variables
Develop another way to find the equation of a line. The lesson introduces the procedure to find the equation of a line given two points on the line. Pupils determine the two points from the graph of the line.
Illustrative Mathematics
Who Has the Best Job?
Making money is important to teenagers. It is up to your apprentices to determine how much two wage earners make with their after school jobs. Participants work with a table, an equation, and a graph and compare the two workers to see...
MARS, Shell Center, University of Nottingham
Defining Regions Using Inequalities
Your young graphers will collaboratively play their way to a better understanding of the solution set produced by the combining of inequalities. Cooperation and communication are emphasized by the teacher asking questions to guide the...
NTTI
Line 'Em Up!
Coordinate planes and Cartesian graphing systems are the focus of this math lesson. Learners use video, internet activities, and engage in hands-on activities in order to explore coordinate planes. The materials needed for this lesson...
Curated OER
Three In a Row
Sixth graders examine how to locate coordinate points. For this coordinate graphing lesson, 6th graders locate the x and y axis. Students use their arms to show horizontal and vertical lines, participate in group and...
Curated OER
Graphs, Stories, And Games
In this graphs lesson, learners read stories and present story situations on a graph. They explore distance and diameter and explain graphs. Students create their own stories to fit graphs.
Curated OER
Locating Points Using Cartesian Coordinates
Pupils discover coordinates as they explore Chicago. In this math lesson plan, students give the coordinates of a point, plot a point, and use the coordinate system in locating places on a map.
Curated OER
Learn How to Graph
Students examine various types of charts and discover how to construct a line graph. Using graph paper, they construct a graph displaying weight loss over a five-year period. They draw copnclusions from the completed graphs.


