Curated OER
Integers
Students graph integers on a number line. In this integers lesson, students create a colored foldable to assist them with notetaking and problem solving. Students complete exercises from text.
Curated OER
Statistics
In this statistics instructional activity, students view 6 graphs to determine the correlation. Students then answer 4 questions that involve plotting data, determining a relationship, and making predictions.
Curated OER
R & R - Incorporating Literature While Teaching Math - Ordered Pairs - "The Polar Express"
Third graders create pictures using ordered pairs after listening to a piece of literature. In this ordered pairs and literature lesson plan, student listen to and discuss The Polar Express by Chris Van Allsburg. They participate in...
Curated OER
Worksheet 35 - Fall 1995
In this math worksheet, students sketch the graphs labeling the point of intersection in the first quadrant. Then they find the area of Ω.
Curated OER
Inquiry Unit: Modeling Maximums and Minimums
Young mathematicians explore the maximun area for patio with the added complexity of finding the mimimum cost for construction. First, they maximize the area of a yard given a limited amount of fence and plot width v. area on a scatter...
Curated OER
Slope
Studying slope? This one page worksheet has it covered! Learners use graphs and coordinates to find slope and also use slope to find a missing coordinate of a point on a line. The lesson also includes a real-world example that asks...
Lane Community College
Review Sheets: Trigonometry
Review guide, practice test, homework packet? Yes, yes, and yes as it's all possible with a wonderful trigonometry packet. Every type of problem is there, starting from the unit circle and ending with conic sections.
Illustrative Mathematics
Equations of Lines
The intent of this resource is to show algebra learners that there is a proportional relationship between two lines that have an intersecting point. As the coordinate x increases by a constant, the y coordinate also increases. It will...
Illustrative Mathematics
Two Lines
Here is a resource that helps your algebra learners understand the connection between the graph of two lines, the equations of lines, and the solutions and intersecting points of lines. It would make a great assessment question, but can...
Curated OER
Investigation-Looking at Polygons
Eighth graders plot points and investigate polygons. They locate a point, using ordered pairs of integers on the coordinate plane. Students compare geometric measurements and computations on coordinate axes as they are applied to...
Curated OER
Am I Straight
Identify the slope of a linear equation in this algebra lesson. Middle schoolers graph linear equations using slopes and intercepts. They identify the slope as being positive, negative, no slope, or undefined.
Virginia Department of Education
Solving Linear Equations
Practice solving linear equations by graphing. Scholars learn to solve multi-step linear equations in one variable by graphing both sides of the equation separately. They use graphing calculators to find the intersection of the graphs.
Curated OER
Relating Algebra to Geometry
Learners investigate the connection that exists between Algebra and Geometry. They classify two and three-dimensional figures. Pupils use formulas to solve problems in geometry and use appropriate measuring devices in the right contexts.
Pennsylvania Department of Education
Problem Solving with Fractions
Solve story problems using fractions or decimals. Then, determine the reasonableness of answers using estimation.The detailed lesson includes essential questions, vocabulary, a materials list, and links to related units.
Curated OER
Geometric Figures-Triangles
Fourth graders explore triangles. In this math lesson, 4th graders discuss the different types of triangles. Students create triangles using wiki sticks. Students complete an online matching game.
Curated OER
Representation of Quadratic Functions
Students use a table, graph or equation to represent a quadratic function. For this algebra lesson, students model and graph with quadratic function. They become comfortable representing quadratics using different methods.
Illustrative Mathematics
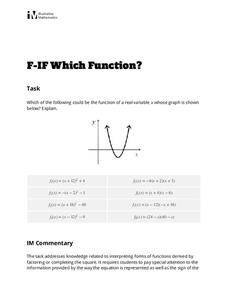
Which Function?
Learners are given a graph of a parabola on a coordinate system, but intercepts and vertex are not labeled. The task is to analyze eight given quadratic functions and determine which ones might possibly be represented by the graph. The...
Curated OER
Discovering Different Types of Functions
Graph polynomials and identify the end behavior of each polynomial function. The class differentiates between linear, quadratic, and other polynomial equations.
Curated OER
Building Sets of 13 and 14
Compose and decompose sets of 13 and 14 and compare sets of each with your little learners. They use objects to construct sets of 13 and 14, record their answers, and compare sets in several different ways.
Virginia Department of Education
Slippery Slope
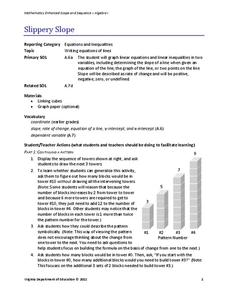
Explore slope using geometric patterns. Young mathematicians investigate towers built from cubes to develop a linear pattern. They move the data to a coordinate plane to connect the pattern to slopes.
Curated OER
Investigation - Looking For Triangles
Seventh graders investigate a series of triangles, looking for patterns and generalizing what they have found. They analyze the pattern data and organize it into a table and graph. Students identify the relationship and discover the rule...
Curated OER
Geometry: Parallel and Perpendicular Lines
This basic handout would be good for skills practice or a review of parallel and perpendicular lines. Review the definitions, then practice writing equations of lines that pass through a specific point and are either parallel or...
Curated OER
You Can Find It!
Students, in groups, use longitude and latitude to locate various places on a map.
Curated OER
Leaf Weight-Loss Plan
Learners measure the weight of a container of leaves daily to discover how quickly it grows lighter as the foliage dries.


