Curated OER
Glacial Striation Investigation
Students operate a GPS unit to investigate the direction of glacier movement. They describe the motion of glacier movement by interpreting a graph. Students explain how scientists use glacier striations to determine glacier movement.
Curated OER
Interpreting Data and Building Hypothesis
Students define the term species, and graph species data together with previously collected data at the National Zoo. They interpret graphed data and recognize patterns in the streamside quadrant versus hillside quadrant. Students use...
Curated OER
Mine Shaft Grade 8 Slope
Eighth graders investigate slopes using real life scenario. In this algebra lesson plan, 8th graders model and interpret real life data. They plot their data in a coordinate plane and discuss the results with the class.
Curated OER
Properties of Exponential Functions
In this algebra worksheet, students graph exponential equations and use the formula to translate the graph on a coordinate plane. There are 3 word problems.
Curated OER
Systems of Linear Inequalities
In this Algebra I/Algebra II learning exercise, students use graphing to solve systems of linear inequalities. The two page learning exercise contains a combination of five multiple choice and free response questions. Answers are...
Curated OER
The Focus of an Ellipse
In this algebra worksheet, students solve for the center of an ellipse by finding the focus. They use the focus formula when solve for conics. There are 13 problems with an answer key.
Curated OER
Linear Equations
In this Algebra I/Algebra II worksheet, students write the equation of a line given the coordinates of two points on the line. The one page worksheet contains a combination of three multiple choice and free response questions. Answers...
Curated OER
Medians and Altitudes of Triangles
In this geometry worksheet, 10th graders determine if a given segment is a median or altitude of a triangle and use then find the indicated missing length or equation of a line. The two page worksheet contains twenty problems. Answers...
Curated OER
TI-Nspire Activity: What Does Your Representation Tell You?
By learning to select the best representation for three meal plans, students compare three meal plans to determine the best choice. Data for the meal plans is sorted on a table, as an algebraic equation, and graphed on a coordinate grid....
Curated OER
The Slope of a Line
In this slope worksheet, students examine graph and determine the slope of a line. They determine coordinates of a point to make a true statement. Students identify the dependent variable and the independent variable. This three-page...
Curated OER
Sign of the Derivative
Learn how to investigate the change in a graph by dragging the cursor to observe the change in the function. They use the TI calculator to graph their parabola.
Curated OER
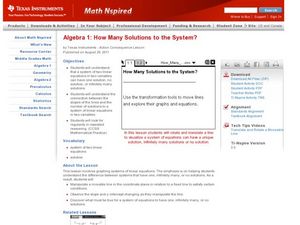
How Many Solutions to the System?
Solve systems of equation using graphing! In this algebra activity, learners use the TI to graph two lines and identify the number of solutions. They perform interactive graphing on the navigator.
Curated OER
The Last Great Race
Third graders identify and discover why the Iditarod race is done each year. They explore the historical significance of the Iditarod. Students also use web sites to research related topics, i.e. diseases (diptheria), geography of...
Curated OER
Standard Form Equation of Ellipse
In this equation of an ellipse worksheet, students find the missing numbers in 8 equations when given the drawing of the ellipse. Students graph 9 ellipses on a coordinate grid when given the equation. In the final activity, students...
Curated OER
Gateway Arc Length
Learners differentiate and calculate the length of an arc. They define an arc and relate it to the area of a circle and integrate the function to solve the equations. Students use their TI calculators to graph the equation.
Texas Instruments
Mean Value Theorem
Students calculate the slopes of secant lines. For this calculus lesson, students graph tangent and secant lines using the coordinate plane. They use the Ti calculator to graph and observe the lines.
Curated OER
Osprey Journey
Students investigate the migration route of one bird, Osprey B4, using information gathered from satellites to track birds over a two-year period. They coimpare their graphs with maps of B4's migrations that have been plotted by...
Curated OER
Slope Exploration
In this slope exploration worksheet, 9th graders solve and complete 18 different problems that include graphing and investigating the slope of various equations. First, they graph each pair of points and draw a line that contains both...
Curated OER
Woody Sine
Students explore the concept of sine. In this sine lesson, students create a sine graph from tooth picks. Students create a unit circle with tooth pick length radius. Students then take the tooth picks from the unit circle and put them...
Curated OER
Calculating Slope
Students find the slope using a slope formula. In this algebra worksheet, students use a pair of coordinate to identify the slope and y intercept. There are 7 questions.
Curated OER
Sudoku Puzzle: Logs and Exponentials
In this logarithms and exponential learning exercise, students solve 29 multiple choice problems. Students use their answers to solve a sudoku puzzle.
Curated OER
Pick's Theorem
Students investigate polygons and their lattice. In this calculus lesson, students record data using different methods. They analyze their data and draw conclusions based on the relationship between the area and the interior lattice.
Curated OER
Cookie Mapping
Students study the components of a bedrock geology map through a hands-on activity involving a cookie and graph paper.
Curated OER
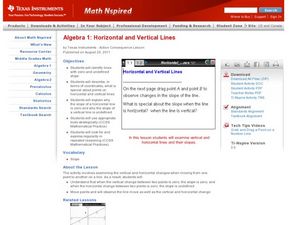
Horizontal and Vertical Lines
High schoolers solve equations and graph-their solutions. In this algebra lesson, students, identify the type of line using the slope of the equation. They graph and observe their lines.


