Curated OER
Data Collection and Graphing
Students collect data and graph it on a coordinate plane and analyze it. In this statistics instructional activity, students display their data collection using a graph. They determine which central tendency will work best.
Curated OER
Graphing Integers
Fifth graders complete an integer graphing activity. In this integer graphing lesson, 5th graders use coordinate grids to help them complete linear functions and integer graphing.
Virginia Department of Education
Transformations
The coordinate plane is a popular place! Identify rotations, reflections, and dilations on the coordinate plane. Pupils work in small groups to match transformations of a figure with the description of the transformation....
Curated OER
Compound Inequalities and Graphing
Put geometry skills to the test! Learners solve compound inequalities and then graph the inequalities on a coordinate plane using their geometric skills. They identify the slope and y-intercept in order to graph correctly. I like this...
Curated OER
Exploring Quadratic Data with Transformation Graphing
Using a data collection device to collect data regarding a bouncing ball, students use various features on graphing calculators to experiment with the parameters of the vertex form of the parabola and their effect on the shape of the...
Illustrative Mathematics
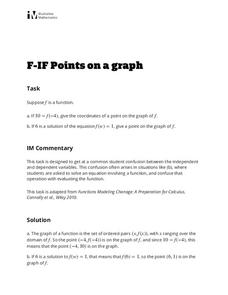
Points on a Graph
Learners practice using their knowledge of how to interpret a function and use function notation. The activity includes two questions. Given an input of a function and its output, the first question asks learners to write the ordered...
Curated OER
Solving multi-step inequalities and solving systems by elimination
Students solve multi-step equations and apply the process of elimination. In this algebra lesson, students solve linear inequalities and equations using linear combination and evaluation. They graph their results on a number line...
Curated OER
Data and Scientific Graphs
Students conduct experiments and graph their data. In this statistics lesson, students collect data and graph it on a coordinate plane. They analyze the data looking for patterns and they discuss their findings with the class.
Curated OER
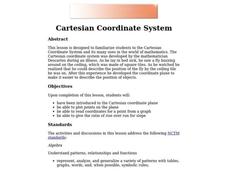
Cartesian Coordinate System
Students explore the Cartesian coordinate plane and plot points on the graph. They interpret coordinates for a point from the graph and give the ratio of rise over run for slope.
Curated OER
Graphing Inequalities
Students graph linear equations and then find the person in class whose linear equation graph is perpendicular to theirs. In this graphing inequalities lesson plan, students graph their perpendicular slopes and then once their find their...
Curated OER
Polar Graphs
Students graph polar graphs. In this calculus lesson, students convert between polar and rectangular coordinates. They graph their solution on the TI calculator and make observations.
Curated OER
Operations and Coordinates: The Coordinate System
Middle schoolers play a "Battleship" type of game to practice graphing on a coordinate grid. In this graphing lesson, students listen as the teacher explains quadrants and ordered pairs. They place their "ships" on the board. The teacher...
Curated OER
Coordinate Crunch
Students identify plots on a graph while playing a game on a large coordinate grid and then on smaller grids.
Curated OER
Solving a Pair of Linear Equations by Graphing
Teach your math lovers how to solve linear equations by graphing. Students identify pairs of coordinates and use it to graph a line and use the TI to graph and observe the line.
Curated OER
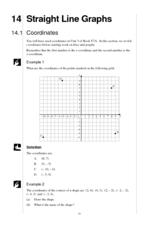
Straight Graph Lines: Coordinates
Students access prior knowledge of coordinates. In this coordinates lesson, students graph coordinate points to create a symmetrical figure and of a straight line. Students complete several practice examples.
Curated OER
Exploring Area/Perimeter Through Coordinate Geometry
Students explore area and perimeter through coordinate geometry using student literature, hands-on manipulatives, and the Internet.
Curated OER
Applications of Properties of Quadrilaterals in the Coordinate Plane
High schoolers explore the concept of quadrilaterals. In this quadrilaterals lesson, students use the slope formula, midpoint formula, and distance formula to justify that a given quadrilateral is a parallelogram.
Curated OER
Using Computers to Produce Spreadsheets and Bar Graphs
Students review graphing terminology and how to plot data points, how to input data into a spreadsheet, and how to make a chart using a computer.
Curated OER
Graphing Linear Equations with Calculator
Students graph lines using the calculator. In this algebra lesson, students graph lines of equations in the form y=mx+b. They input equations into the TI Calculator and graph using the slope and intercept. They analyze the graph for...
Curated OER
Olympic Line Graphs
Sixth graders examine how to make line graphs. In this Olympic line graph lesson students make line graphs and search the given Internet sites to find data on their summer Olympic Game.
Curated OER
Graph Paper
Students are given pre-made graph paper. In this algebra instructional activity, students are given copies of graph paper that can be used to plot points on a coordinate plane already measured out.
EngageNY
Searching a Region in the Plane
Programming a robot is a mathematical task! The activity asks learners to examine the process of programming a robot to vacuum a room. They use a coordinate plane to model the room, write equations to represent movement, determine the...
EngageNY
Lines That Pass Through Regions
Good things happen when algebra and geometry get together! Continue the exploration of coordinate geometry in the third lesson in the series. Pupils explore linear equations and describe the points of intersection with a given polygon as...
EngageNY
Geometric Interpretations of the Solutions of a Linear System
An intersection is more than just the point where lines intersect; explain this and the meaning of the intersection to your class. The 26th segment in a 33-part series uses graphing to solve systems of equations. Pupils graph linear...


