Curated OER
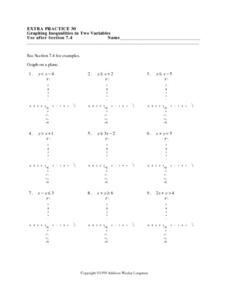
Graphing Inequalities in Two Variables: Extra Practice 30
In this math worksheet, students graph inequalities on a coordinate grid. The eight problems have a coefficient of one for the y variable. Three problems have a negative value for y. The final four problems are horizontal or vertical lines.
Curated OER
Graphing Linear Equations
Ninth graders review the information that they have already learned
with regard to linear equations and graphical representations. They then assist in combining equations with a graphical element and complete various graphs with this...
Curated OER
LAND USE ISSUES
Students relate math with real life situations. They identify and plot points on a grid map. They identify and locate the Drop Box Sites.
Curated OER
Using the Balance
Students determine the mass of various objects. In this integrated math and science lesson, students use an arm balance to compare a known object to a combination of washers with a fixed weight. Students record data, construct a bar...
Curated OER
More graphing situations by making a table
Students make a table and graph plotting points. In this algebra lesson, students graph linear equations on a coordinate plane. They calculate the rate of change and analyze the graph for extrapolation.
Curated OER
Worksheet 25
In this math worksheet, students draw a graph of functions on a polar graphing system. They graph two functions by first plotting them on the vertical axis as a function of a given angle, then by plotting them at a radial distance from...
Curated OER
Ellipses and Kepler's First Law
The class examines graphs in the form r = F(¿¿) in polar coordinates (r, ¿¿), in particular with the circle, ellipse and other conic sections. They determine the nature of an ellipse by studying the role of the semimajor axis and...
Curated OER
Worksheet 38-Spring 1996
In this math worksheet, students determine if the definite integral of given functions exist. They use a Taylor polynomial to approximate given values. Students express the arc length of a graph on a polar coordinate system as an integral.
Curated OER
Fishing for Points
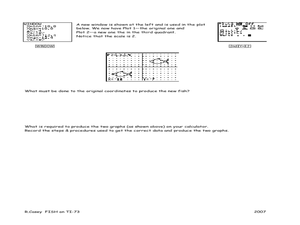
Learners explore the concept of ordered pairs. In this ordered pairs lesson, pupils list the ordered pairs of a graph in the shape of a fish. They use their calculator to translate the fish using lists, then translate the fish left,...
Curated OER
Grids
Take your study of coordinates online! Groups of students complete an online graphing introduction, plotting the points of virtual objects. A worksheet is included for extra practice.
Curated OER
Graphing X, Y, Z
Seventh graders explore how proportion controls the image of a drawing. They examine a coordinate plane and discuss plotting. Student experiment drawing an object one size, and then drawing an identical object on a different scale.
Curated OER
What's Your Shoe Size? Linear Regression with MS Excel
Learners collect and analyze data. In this statistics activity, pupils create a liner model of their data and analyze it using central tendencies. They find the linear regression using a spreadsheet.
Curated OER
Vectors: Follow That Arrow
Vectors and their connection to motion. A video will be presented to provide information for the class to use methods of solving vectors with and without grids. Real-world physical concepts will be explored in reference to vectors.
Curated OER
What's Up With My Class
Middle schoolers collect data about their class and they use Excel spreadsheet to display their tables and graphs about the class. They answer survey questions and collect their data. Students create a graph of their choice to display...
Curated OER
Perplexing Puzzles
Elementary and middle schoolers explore scatter plots. In this graphing activity, pupils work in small groups and use jigsaw puzzles to develop a scatter plot. Younger students may develop a bar graph.
Teachers Network
A World of Symmetry: Math-Geometry
Define and identify the three basic forms of symmetry translation, rotation, and glides with your class. They cut out and arrange paper pattern blocks to illustrate symmetry, create a Cartesian graph, and design a rug with a symmetrical...
EngageNY
Analyzing Residuals (Part 1)
Just how far off is the least squares line? Using a graphing calculator, individuals or pairs create residual plots in order to determine how well a best fit line models data. Three examples walk through the calculator procedure of...
University of Colorado
Solving a Mixed Up Problem
Begin the process of adding and subtracting spectra. Having a basic understanding of occultation events, pupils begin the pursuit to determine what a found atmosphere might contain. Learners work with two graphs and calculate what the...
West Contra Costa Unified School District
Congruence Through Transformations
Transform your instructional activity on transformations. Learners use given congruent triangles and tracing paper to determine the single transformation that carries one to the other. The concept is extended to combinations of...
Georgia Department of Education
Math Class
Young analysts use real (provided) data from a class's test scores to practice using statistical tools. Not only do learners calculate measures of center and spread (including mean, median, deviation, and IQ range), but...
Curated OER
X & Y Coordinates
Young scholars identify and plot points. In this graphing lesson, students use an X and Y coordinate grid to locate missing spacecraft on a coordinate grid sheet.
Curated OER
Coordinate Geometry
Grab your class and get them graphing polygons on a coordinate plane! They investigate the four quadrants, discover the x and y axis, and correctly plot ordered pairs. To show their comprehension, each child creates a coordinate picture...
Curated OER
Graphing Functions With 2 Points and From a Graph
Learners plot points on a coordinate plane. They describe, in words, methods for finding the slope of a line. After given a worksheet, students read instructions, draw a Cartesian plane, plot ordered pairs, and graph lines. Papers are...
Curated OER
Equations and Inequalities
Students in a college algebra class use graphs to solve inequalities. Using the coordinate graphing system, they represent the relationship between x and y intercepts. They practice solving equations with complex numbers and locate...


