Curated OER
Tables and Data
In this tables and data worksheet, students use a given data table to answer a set of 8 questions. A website reference for additional activities is given.
Curated OER
Data and Tables
In this data and tables worksheet, students use a given data table to answer a set of 8 questions. A website reference is given for additional resources.
Curated OER
Tables and Data
In this tables and data worksheet, 4th graders complete word problems based on the tables and data of students recycling cans. Students complete 8 problems total.
Curated OER
Tables & Data
For this tables and data worksheet, 4th graders complete word problems based on a table of leaves collected. Students complete 8 problems.
Curated OER
Graph Those Stickers!
Students graph fruit. In this graphing lesson students create a graph using fruit label stickers. Students place a sticker on the graph when the fruit has been consumed.
Curated OER
Savings Planning Using Tables, Line Graphs and Early Proportionality
Students use proportional reasoning to make a chart of daily savings transactions and balances. In this accounting lesson, students read word problems and complete three handouts about a bidding and accounting problem. Students finish...
Curated OER
Angles and Arcs
In this angles and arcs worksheet, 10th graders solve 18 various types of problems related to determine various angles and arcs of a circle. First, they find the measure of each angle and arc of the first circle shown. Then, students...
Curated OER
Birds of Wetlands Facts Table Activity
In this birds of wetlands worksheet, students create a table on the internet to insert facts of the birds in the wetlands. Students make a table for 9 birds.
Science 4 Inquiry
Edible Plate Tectonics
Many people think they can't observe plate tectonics, but thanks to GPS, we know that Australia moves at a rate of 2.7 inches per year, North America at 1 inches per year, and the Pacific plate at more than 3 inches per year! Scholars...
American Chemical Society
Using Color to See How Liquids Combine
Blue-tinted water is added to unknown liquids that have been tinted yellow to find out how they interact. This is a memorable activity that is part of an investigation on the properties of liquids, which is part of a unit on the...
Curated OER
Solar Kit Lesson #7 - Positioning Solar Panels I: Explorations with Tracking
In this first part of a two-part lesson, learners track and record the sun's azimuth using a solar panel. They graph and analyze the data to identify relationships among the time of day, the altitude and azimuth of the sun, and the...
Serendip
Is Yeast Alive?
Through two investigations, life science learners determine whether or not yeast is alive. They perform tests for metabolism by providing sugar and observing if gas is produced as a byproduct. They incubate some of the sample for at...
PhET
Radioactive Dating Game
Uranium 235 has a half-life of over 700 million years and is the fuel used in the atomic bomb dropped on Hiroshima, Japan. Pupils see the half-lives and decay rates of Carbon-14 and Uranium-238. They also take measurements of these two...
Science Geek
Measurement of Pressure and Temperature
We all have standards and scientists are no exception. Presentation covers standard temperature, standard pressure, temperature conversions, and absolute zero. It explains pressure using pascals, mm of mercury, atmosphere, and torr, then...
Curated OER
Tables & Data
In this subtraction learning exercise, 4th graders problem solve 8 sentence subtraction word problems involving different types of birds. Students write their answers on the lines provided.
Curated OER
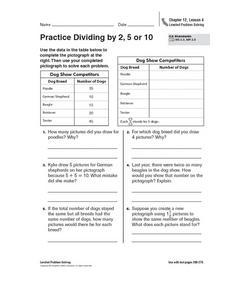
Practice Dividing by 2, 5, or 10
In this pictograph problem solving worksheet, students analyze the data on a table and create a pictograph. Students read and solve 6 story problems about the pictograph.
Curated OER
Freshman Project-Part 5
In this project instructional activity, 9th graders display their data, the make a graph and they answer analysis and conclusion questions on their experimental design project. They discuss the variables of their experiment, their major...
Curated OER
Line Graphs
In this line graphs activity, 8th graders solve and complete 20 different problems that include reading various line graphs. First, they use the information provided in each line graph to determine the correct response to each of the...
Curated OER
Organizing Data
In this statistics activity, 11th graders collect data and organize it using a frequency table. They plot their data and analyze it using stem and leaf plots. There are 3 questions with an answer key.
Curated OER
Comparing Data
Eighth graders create a survey, gather data and describe the data using measures of central tendency (mean, median and mode) and spread (range, quartiles, and interquartile range). Students use these measures to interpret, compare and...
Curated OER
Double Bar Graphs (Reteach 15.1)
In this graphs worksheet, students analyze the data on two double bar graphs. Students answer 4 questions about the information on the graphs.
Curated OER
Information at a Glance - Using Tables in Mathematics
Young scholars create table to display GED Testing data located in paragraph provided by teacher, use information in table to create appropriate graph, and determine percentage difference between passing scores and failing scores.
Curated OER
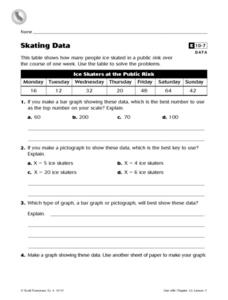
Skating Data
In this collecting data worksheet, 4th graders view a table on ice skaters at a public rink in order to answer 2 multiple choice questions, 1 short answer question and make a graph showing one piece of the data.
Curated OER
Using Diagrams in Problem Solutions
Students use tables, graphs and diagrams to collect data. In this problem solving with diagrams lesson plan, students construct their own tables and graphs containing information they gather from a drawing. They also make a Venn Diagram...


