Curated OER
Beginning Modeling for Linear and Quadratic Data
Students create models to represent both linear and quadratic equations. In this algebra lesson, students collect data from the real world and analyze it. They graph and differentiate between the two types.
Curated OER
Pizza Possibilities
Middle schoolers create and interpret line plots, bar graphs, and circle graphs. The lesson assumes mastery of conversions from fraction to decimal to percent, construction of angles, and at least an introduction to graphs displaying data.
Curated OER
Introduction to Graphs
Students poll classmates to gather information for a graph. They identify three types of graphs (bar, line, table). Students create each type of graph using data gathered from classmates.
Curated OER
Watch the Birdie
In this data table worksheet, students solve 6 word problems in which information about birds on a data table is used to answer each question.
Curated OER
VARIABLES AND PATTERNS, USE AFTER INVESTIGATION THREE. DISCRETE OR CONTINUOUS LINEAR RELATIONS.
Learners discover for which kind of linear function is appropriate to use the "scatter" or the "connected" term. In this instructional activity, students investigate functions using variables, patterns book, graph paper, rulers and the...
Curated OER
Two Ways to Solve
For this data table worksheet, students solve 4 word problems using the information on a data table about raffle tickets sold by 5 students.
Curated OER
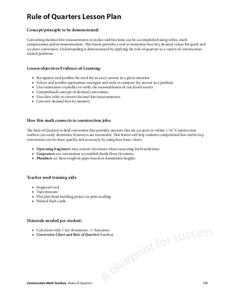
Rule of Quarters
Young scholars memorize four key decimal values for quick and accurate conversion. They convert decimal foot measurements to inches and fractions using math tables, computation or memorization. They memorize decimal foot conversions.
Curated OER
Range and Mode Reteach 4.5
In this range and mode worksheet, students analyze the data table and graph that show numbers of books read. Students use the data to answer 4 questions.
Curated OER
Line Graphs
In this line graphs worksheet, 8th graders solve and complete 10 different problems that include various line graphs. First, they use each line graph shown to respond to the questions that follow regarding books and population. Then,...
Curated OER
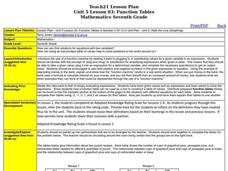
Function Tables
Young scholars identify function using tables of data. In this algebra lesson plan, students create a tale of point and plot on a coordinate plane. They analyze the graph as being a function or not.
Curated OER
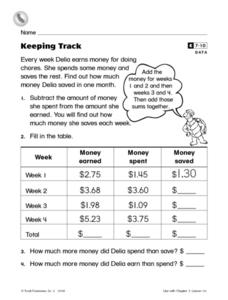
Keeping Track
In this data table worksheet, students complete a table with information on money earned, spent and saved in each of 4 weeks for a student's job.
Curated OER
Where do Plants Get their Food?
In this where do plants get their food worksheet, students design an experiment that will disprove the idea that plants obtain their food from soil. Students will set up their experiment and design a data table that will record data over...
Curated OER
Reading and Making Pie Graphs
In this pie graphs worksheet, students solve 10 different problems that include reading a pie graph. First, they use the pie graph to respond to 5 questions that follow. Students determine the year that had the smallest and largest...
Curated OER
Questionnaires and Analysis
Students, review the techniques and different types of data analysis as well as how they are expressed, identify why facts and data are needed in conclusion of a questionnaire. The concepts of qualitative and quantitative data are...
Curated OER
Linking Real World Data to the Classroom
Students analyze data representing real life scenarios.In this algebra lesson, students collect, plot and analyze data using a graph. They use different methods to represent and present their data.
Curated OER
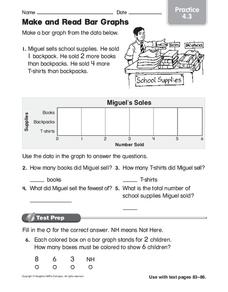
Make and Read Bar Graphs
In this bar graphs worksheet, students make a bar graph about the sale of school supplies with the data presented in one story problem.
Curated OER
Seized Before Flights: Graph
In this bar graph worksheet, students analyze a graph that show the number of prohibited items intercepted at U.S. airport screening checkpoints. Students answer 3 problem solving questions about the data on the graph.
Curated OER
Data Representation
Learners solve real life scenarios using math. In this geometry lesson, students collect, predict and interpret data. They measure a chair using different measurements and choose what would make the chair the best design.
Curated OER
Tally Chart: Favorite Names
In this data display worksheet, students analyze a tally chart of favorite hamster names. Using the information on the chart, students solve 8 word problems.
University of Rhode Island
How Does the Human Body Use Energy during Various Athletic Activities?
Students investigate how much energy is used during different athletic activities. They conduct Internet research to obtain information on the top three athletic sporting events from around the world, and calculate the calories burned...
The New York Times
Laboratory Experiment
For any science class, learners can use this lab sheet to plan an experiment. It includes a space for the title, question, materials, setup, and procedure. If you want your class to complete this in typed form, you can provide the web...
Curated OER
Effects of chemical use in Agriculture
Students research environmental data to create a bar graph. In this agricultural ecology lesson, students research the pros and cons of chemical use in farming. Students debate on passing a law to reduce chemical use.
Curated OER
Using Tiles to Solve Word Problems
Young scholars solve problems using equations. In this algebra instructional activity, students identify the correct symbols and steps when solving word problems. They graph their lines and analyze the slope using tiles.
Curated OER
Using Graphs and Charts
Students complete T charts and manipulate numbers using graphs and charts. In this math graphs and charts lesson, students review the concepts of pattern and function. Students then complete practice pages where they manipulate numbers...


